Correlation Analysis - Full Course
TLDRThis video script delves into the concept of correlation analysis, explaining its significance and the different types of correlation coefficients, including Pearson, Spearman, Kendall's Tau, and Point-Biserial. It clarifies the distinction between correlation and causation, emphasizing that correlation does not imply causation and highlights the importance of understanding the relationship between variables without assuming a cause-effect link.
Takeaways
- 📊 Correlation analysis is a statistical method to measure the relationship between two variables, such as salary and age.
- 🔢 The correlation coefficient ranges from -1 to 1, indicating the strength and direction of the relationship, with -1 being a perfect negative correlation and 1 being a perfect positive correlation.
- 📈 A positive correlation means that high values of one variable are associated with high values of another, while a negative correlation indicates the opposite.
- 👞 Pearson correlation coefficient is used to measure the linear relationship between two metric variables, and is calculated using a specific formula involving the mean values of the variables.
- 🔄 To test the significance of the Pearson correlation, a t-test is used, comparing the correlation coefficient against zero to determine if there is a statistically significant linear relationship.
- 🎩 Spearman rank correlation is a non-parametric measure that uses the ranks of the data instead of the raw data, suitable for non-normally distributed data or ordinal data.
- 🤝 Kendall's Tau is another non-parametric test that measures the relationship between two variables on an ordinal scale, preferring it when there are many tied ranks.
- 📚 Point-biserial correlation is used to examine the relationship between a metric variable and a dichotomous variable, such as the correlation between study hours and pass/fail results.
- 🚫 It's important to distinguish between correlation and causation; correlation does not imply causation, and additional conditions must be met to establish causality.
- 🕒 Establishing causality requires a significant correlation, chronological sequence, controlled experimentation, or a well-founded theory indicating the direction of the effect.
- 🔮 The script emphasizes the importance of not mistaking correlation for causation, as incorrect assumptions can lead to flawed conclusions, as illustrated by the example of head lice and body temperature.
Q & A
What is correlation analysis?
-Correlation analysis is a statistical method used to measure the relationship between two variables. It helps to determine how strong the correlation is and in which direction it goes, with the correlation coefficient ranging between -1 and 1.
What does the correlation coefficient indicate about the strength of a relationship?
-The correlation coefficient indicates the strength and direction of a relationship. If the coefficient (R) is between 0 and 0.1, there is no correlation. If R is between 0.7 and 1, it indicates a very strong correlation.
What is the difference between a positive and negative correlation?
-A positive correlation exists when high values of one variable are associated with high values of another variable, or low values with low values. A negative correlation exists when high values of one variable are associated with low values of another variable, and vice versa.
What are the different types of correlation coefficients mentioned in the script?
-The script mentions Pearson correlation, Spearman rank correlation, Kendall Tau, and Point-biserial correlation as different types of correlation coefficients.
How is the Pearson correlation coefficient calculated?
-The Pearson correlation coefficient is calculated using an equation that involves the individual values of the two variables, their mean values, and the multiplication and summation of the differences from the mean values.
What assumptions are necessary for calculating the Pearson correlation coefficient?
-To calculate the Pearson correlation coefficient, it is assumed that there are only two metric variables present and, if testing a hypothesis, that the variables are normally distributed.
How does the Spearman rank correlation differ from the Pearson correlation?
-The Spearman rank correlation differs from the Pearson correlation in that it uses the ranks of the data instead of the raw data, making it a non-parametric test that does not assume a normal distribution of the data.
What is the purpose of Kendall Tau correlation?
-Kendall Tau correlation is used to measure the relationship between two variables on an ordinal scale. It is preferred over Spearman's correlation when there are very few data with many ranked ties available.
What is Point-biserial correlation and when is it used?
-Point-biserial correlation is a special case of Pearson correlation used to examine the relationship between a dichotomous variable (with two values) and a metric variable. It is used when you want to know if there is a relationship between a binary outcome and a continuous variable.
What is the difference between correlation and causation?
-Correlation indicates a relationship between two variables but does not imply a cause-effect relationship. Causation, on the other hand, implies a direct cause and effect where one variable influences the other. Causation requires a significant correlation, chronological sequence, controlled experiment, or a well-founded theory.
How can a misunderstanding of correlation as causation lead to incorrect conclusions?
-A misunderstanding of correlation as causation can lead to incorrect conclusions because it assumes one variable causes the effect observed in another variable without considering other factors or the actual temporal sequence of events.
Outlines
📊 Introduction to Correlation Analysis
This paragraph introduces the concept of correlation analysis, a statistical method used to measure the relationship between two variables. It explains the importance of determining the strength and direction of the correlation through the correlation coefficient, which ranges from -1 to 1. The paragraph also distinguishes between positive and negative correlations using examples like body size and shoe size, and product price and sales volume. Different types of correlation coefficients are mentioned, such as Pearson, Spearman, Kendall's Tau, and Point-biserial correlation, setting the stage for a deeper exploration in subsequent paragraphs.
🔍 Understanding Pearson Correlation
The second paragraph delves into the specifics of the Pearson correlation coefficient, which measures the linear relationship between two metric variables. It describes how the Pearson correlation is calculated using an equation that involves the individual values, mean values, and standard deviations of the variables. The paragraph also discusses the process of hypothesis testing in correlation analysis, where the null hypothesis typically states no significant linear relationship, and the alternative hypothesis suggests otherwise. The use of a t-test to determine statistical significance is also explained, along with the assumptions required for Pearson correlation, such as normal distribution of variables.
🏅 Spearman and Kendall's Tau Correlations
This paragraph introduces two non-parametric measures of correlation: Spearman's rank correlation and Kendall's Tau. Unlike Pearson, these coefficients do not require the raw data but rather the ranks of the data. The paragraph explains the process of assigning ranks to data and how both Spearman and Kendall's Tau are calculated, with examples provided to illustrate the calculation. It also discusses the conditions under which each correlation coefficient is preferred, such as the presence of tied ranks and the distribution of data.
📚 Point-biserial Correlation
The fourth paragraph focuses on the Point-biserial correlation, which is used to examine the relationship between a dichotomous variable and a metric variable. It explains the process of assigning numerical values to the categories of the dichotomous variable and then calculating the correlation coefficient using a specific formula. The paragraph also discusses the assumptions for using Point-biserial correlation, such as the normal distribution of the metric variable, and how to test the significance of the correlation coefficient.
🔗 The Difference Between Correlation and Causation
The fifth paragraph addresses the critical distinction between correlation and causation. It emphasizes that while correlation indicates a relationship between two variables, it does not imply a cause-effect relationship. The paragraph provides examples to illustrate this point, such as the correlation between ice cream sales and sunburns, which are both influenced by a third variable—sunny weather. It also outlines the conditions required to establish causality, including a significant correlation, chronological sequence, controlled experiment, or a well-founded theory.
🚫 Misinterpreting Correlation as Causation
The final paragraph warns against the common mistake of misinterpreting correlation as causation. It uses an example of a negative correlation between the number of head lice and body temperature to demonstrate how incorrect assumptions can lead to false conclusions about causality. The paragraph reinforces the importance of understanding the conditions necessary for establishing a causal relationship and the need for careful statistical interpretation to avoid such errors.
Mindmap
Keywords
💡Correlation Analysis
💡Correlation Coefficient
💡Pearson Correlation
💡Spearman Correlation
💡Kendall's Tau
💡Point Biserial Correlation
💡Null Hypothesis
💡Significance Level
💡Causation
💡Assumptions
Highlights
Correlation analysis is a statistical method to measure the relationship between two variables.
The correlation coefficient ranges from -1 to 1, indicating the strength and direction of the correlation.
A positive correlation implies high values of one variable are associated with high values of another.
A negative correlation indicates high values of one variable are associated with low values of another.
Pearson correlation coefficient measures the linear relationship between two metric variables.
Spearman rank correlation is a non-parametric method using data ranks instead of raw data.
Kendall's Tau is a non-parametric test for ordinal scale variables and is preferred with many ranked ties.
Point-biserial correlation examines the relationship between a dichotomous and a metric variable.
The calculation of the Pearson correlation involves summing the product of the differences from the mean.
Spearman correlation can be calculated using the ranks of the variables.
Kendall's Tau is calculated using the number of concordant and discordant pairs.
Point-biserial correlation requires converting the dichotomous variable into numerical scores.
Statistical significance of the correlation coefficient is tested using a t-test.
Assumptions for Pearson correlation include normal distribution of variables and linearity.
Causality is different from correlation; it implies a cause-effect relationship.
Correlation does not imply causation; it only indicates a relationship between variables.
Establishing causality requires a significant correlation, chronological sequence, controlled experiment, or a well-founded theory.
Common mistakes in statistics include assuming correlation as causation without meeting the conditions for causality.
Transcripts
Browse More Related Video
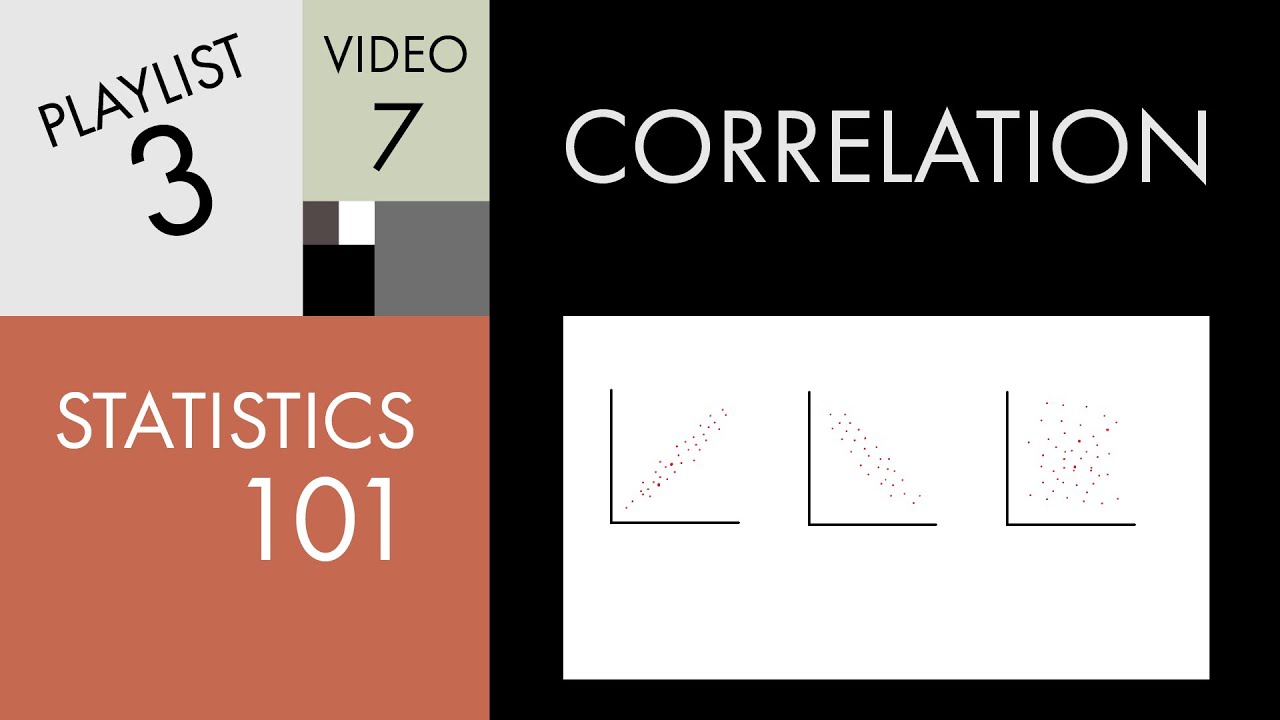
Statistics 101: Understanding Correlation
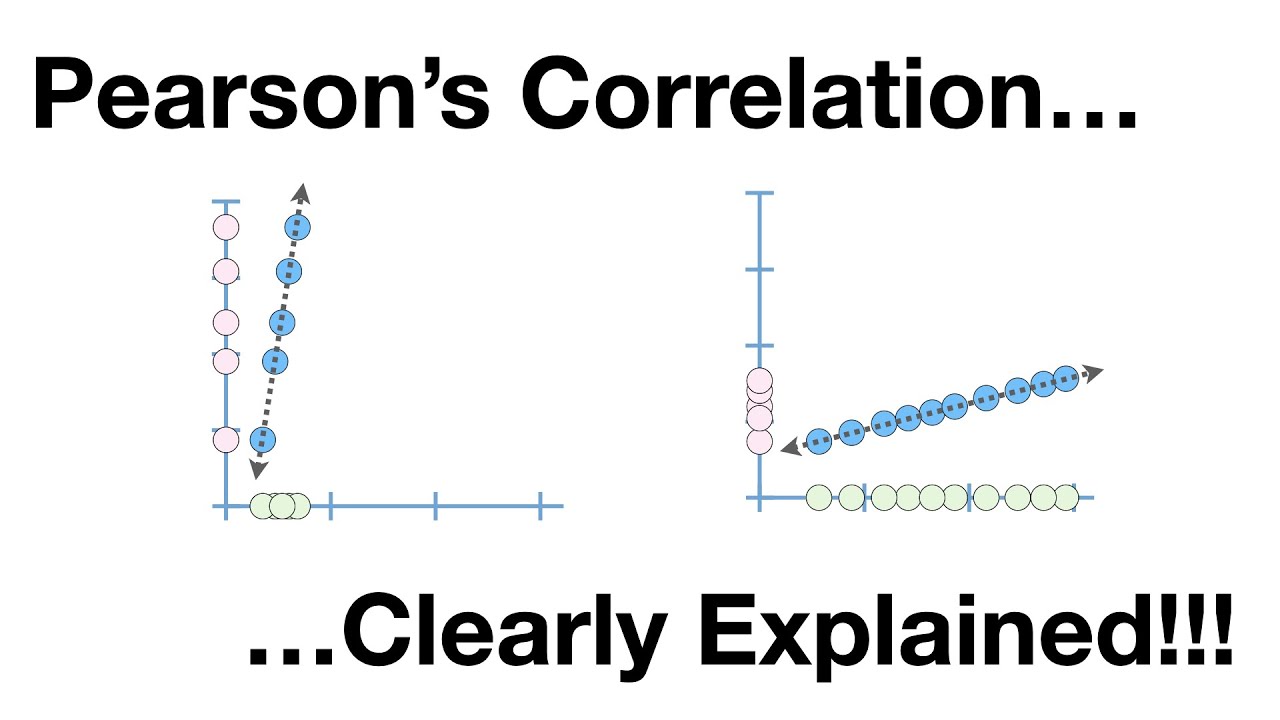
Pearson's Correlation, Clearly Explained!!!
Elementary Statistics - Chapter 10 Correlation and Regression
10.1.3 Correlation - Testing a Claim of Correlation Using the Critical Value Method
Correlation Doesn't Equal Causation: Crash Course Statistics #8
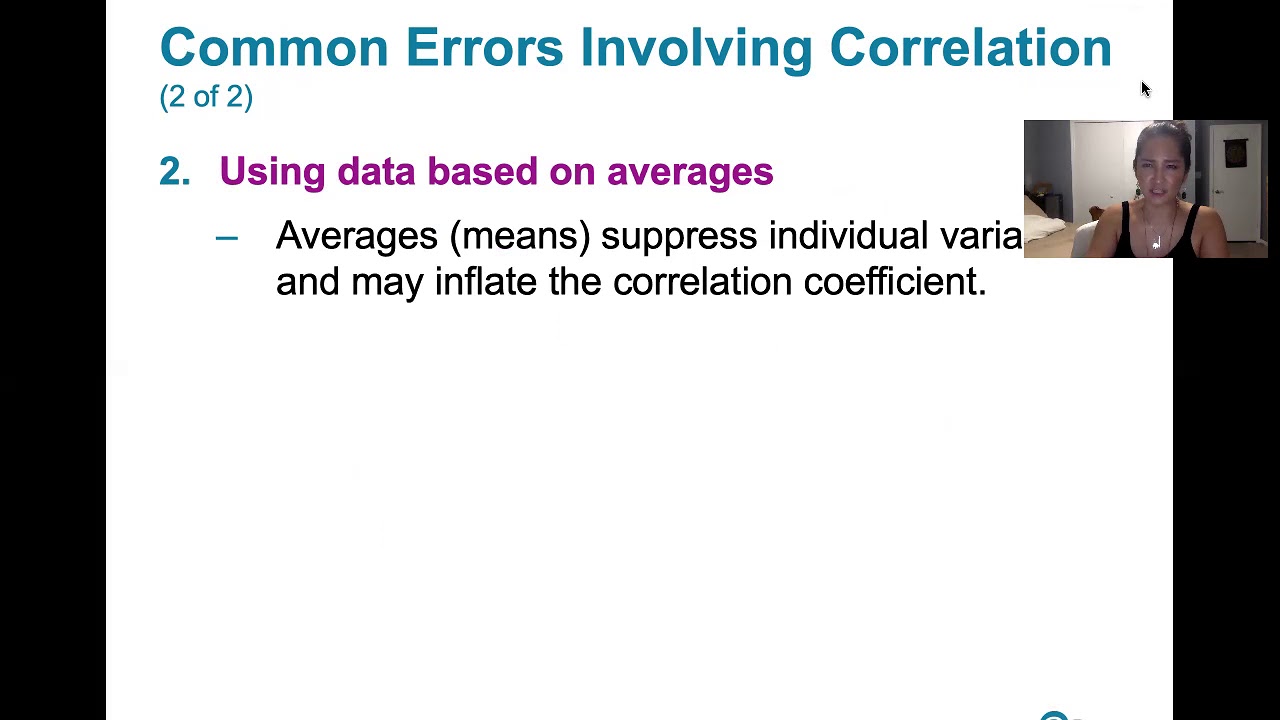
10.1.4 Correlation - Three Common Errors Involving Correlation
5.0 / 5 (0 votes)
Thanks for rating: