Latin Square Design + R Demo
TLDRThis video delves into the Latin square design, an experimental statistical method for analyzing data with three factors. It explains the concept, its origin from ancient civilizations, and its popularization by Euler and Fisher. The presenter illustrates the design with a 4x4 grid example and discusses its application in a historical study on sheep diets. The video concludes with an R demo, demonstrating how to analyze data using the Latin square design, revealing that different diets do not significantly affect sheep weight gain, suggesting cost-effective farming practices.
Takeaways
- 📚 The video discusses the Latin square design, a type of experimental design in statistics.
- 🔍 It begins with background information and concludes with an R demo for data analysis using this design.
- 📈 The Latin square design is a special case of an ANOVA model with three factors, including an outcome variable Y and two blocking factors B1 and B2.
- 🌟 The design requires that the number of factor levels in all three variables (A, B1, B2) be the same, forming various sizes like 3x3, 4x4, or 9x9.
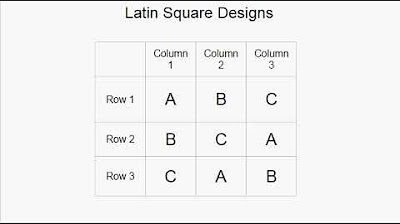
- 🎨 The concept is visualized using a Latin square, where each treatment group occurs exactly once in every row and column.
- 📜 The term 'Latin square' comes from the use of Latin letters to denote treatment groups, with a history dating back to ancient civilizations.
- 👨🏫 Euler popularized the study of Latin squares in mathematics, while Ronald Fisher introduced them in statistics through his 1935 textbook.
- 🐑 The first Latin square experimental design is attributed to a French researcher, Cretté, who studied the effect of diet on sheep weight in 1788.
- 📊 The video includes an R demo using the 'agridat' package to analyze the sheep dataset, focusing on the weight difference as the outcome variable.
- 📝 The ANOVA model in R is applied to test the effect of different diets on weight difference, considering breed and slaughter date as blocking factors.
- 📉 The analysis shows that the diets (potatoes, turnips, beets, corn) do not significantly affect the weight of sheep when controlling for breed and month, suggesting cheaper diets can be used.
Q & A
What is the Latin square design in statistics?
-The Latin square design is a special case of an ANOVA model with three factors, used in experimental design to analyze the effects of a treatment factor while controlling for two blocking factors. It is characterized by having the same number of factor levels across all three variables.
What are the three components of a Latin square design?
-The three components of a Latin square design are an outcome variable (Y), a treatment factor (A), and two blocking factors (B1 and B2), all of which are categorical random variables with the same number of factor levels.
How is the Latin square design visualized?
-The Latin square design is visualized using a grid where each unique treatment group or factor level is represented by a letter or symbol, and each appears exactly once in every row and column, ensuring all combinations are represented.
What is the significance of the number of factor levels in a Latin square design?
-The number of factor levels determines the size of the Latin square grid. For example, a 3x3 Latin square design has three factor levels for each variable, while a 4x4 design has four, and so on.
Who was the first person to popularize the study of Latin squares as a mathematical concept?
-The mathematician Euler was the first person to popularize the study of Latin squares as a mathematical concept, with a paper published in the late 1700s.
How did Ronald Fisher contribute to the Latin square design in the context of experimental design?
-Ronald Fisher popularized the discussion of Latin squares as a type of experimental design in his 1935 textbook 'The Design of Experiments,' where he devoted a chapter to discussing Latin square designs.
What was the first instance of a Latin square design in a statistical experiment?
-The first instance of a Latin square design in a statistical experiment is credited to a French researcher named Cretté, who published a paper in 1788 about testing the effect of diet on the weight of sheep using a 4x4 Latin square design.
What was the purpose of Cretté's experiment?
-Cretté's experiment aimed to test the effect of different diets (potatoes, turnips, beets, and corn) on the weight gain of sheep, with the goal of finding a cheaper and more effective diet to increase the meat yield of the animals.
How did Cretté's experiment utilize the Latin square design?
-Cretté's experiment utilized the Latin square design by assigning four different diets to four different breeds of sheep, with each breed being slaughtered on different months, thus creating a 4x4 Latin square with treatments and blocking factors.
How can one analyze data from a Latin square design using R?
-In R, data from a Latin square design can be analyzed by fitting an ANOVA model to the data using the 'lm' function, considering the treatment and blocking factors as categorical variables, and then using the 'anova' function to test the significance of the treatment effect.
What was the conclusion of the analysis in the video script regarding the effect of diet on the weight of sheep?
-The analysis concluded that the different diets (corn, beets, turnips, and potatoes) were not significantly affecting the weight of the sheep after they were slaughtered, when controlling for breed and slaughter date.
Outlines
📊 Introduction to Latin Square Design in Statistics
This paragraph introduces the concept of the Latin square design, a specific type of experimental design used in statistics. It explains that this design involves an outcome variable Y and three factors, one of which is a treatment factor (A) and the other two are blocking factors (B1 and B2). The uniqueness of the Latin square design is that all three factors have an equal number of levels, creating a balanced setup that allows for the analysis of treatment effects while controlling for other variables. The paragraph also mentions that this design can be visualized through a Latin square, a mathematical concept where each symbol appears exactly once in each row and column, and touches upon the historical aspect of Latin squares, mentioning the mathematician Euler and statistician Ronald Fisher's contributions to the field.
🐑 Historical Application of Latin Square Design: Cretté's Sheep Experiment
The second paragraph delves into the historical application of the Latin square design through an experiment conducted by a French researcher named Cretté in 1788. Cretté aimed to investigate the impact of different diets on the weight gain of sheep, using a 4x4 Latin square design. The experiment involved four diets (potatoes, turnips, beets, and corn), four breeds of sheep as a blocking factor, and four different slaughter dates. The data from this experiment is publicly available and is used to demonstrate how to analyze data using R, a statistical programming language. The paragraph outlines the steps for recreating Cretté's analysis in R, including the use of the 'agridat' package and the fitting of an ANOVA model to the dataset.
📊 R Demonstration and Analysis of Cretté's Sheep Dataset
In the final paragraph, the script describes a practical demonstration of how to analyze a Latin square design using R. It mentions the creation of a dataset focusing on the weight difference of sheep rather than their individual weights at different times. The analysis involves fitting an ANOVA model to the dataset to examine the effect of the diet on the weight difference, controlling for breed and slaughter month. The script provides a step-by-step guide on how to run the ANOVA in R and interpret the results, specifically looking at the F statistic and p-value to determine the statistical significance of the diet's effect on sheep weight. The conclusion drawn from the analysis is that the different diets do not significantly affect the weight of the sheep, suggesting that cheaper grains can be used without compromising the outcome.
Mindmap
Keywords
💡Latin square design
💡ANOVA model
💡Categorical random variable
💡Blocking variables
💡Treatment groups
💡Factor levels
💡Outcome variable
💡R demo
💡Experimental design
💡Statistical significance
💡F-test
Highlights
Introduction to Latin square design as a type of experimental design in statistics.
Explanation of Latin square design as a special case of ANOVA model with three factors.
Description of the outcome variable Y and the three factors A, B1, and B2 in the model.
Requirement for equal number of factor levels across the three categorical variables.
Examples of different Latin square designs, such as 3x3, 4x4, and 9x9.
Visualization of treatment combinations using Latin squares in mathematics.
Historical background of Latin squares from ancient civilizations to Euler and Ronald Fisher.
Ronald Fisher's contribution to the discussion of Latin squares in 'The Design of Experiments'.
Crediting Cretté for the first instance of a Latin square design in a statistical experiment in 1788.
Overview of Cretté's experiment on the effect of diet on the weight of sheep.
Details of the 4x4 Latin square design applied to Cretté's sheep diet experiment.
Statistical analysis of Cretté's data using R to recreate the experiment's analysis.
Use of the agridat R package and manipulation of the sheep dataset for analysis.
ANOVA model fitting in R for the Latin square design with the sheep dataset.
Interpretation of the ANOVA table and the F-test result for the effect of food on weight difference.
Conclusion that different diets are not significantly affecting the weight of sheep after controlling for breed and month.
Practical implication of the study for choosing cheaper crops for sheep feed.
Transcripts
Browse More Related Video
Latin Square Designs

Euler Squares - Numberphile

Types of Experimental Research Designs - CRD RBD RCBD LSD FD - Research Methods - Practical Research

RM-15 | Latin Square Design (in Hindi) | LS Design | Formal Experimental Research Design
Lecture 18 Experimental Designs; Completely Randomized Design CRD; One Way ANOVA

Mixed Model ANOVA (Analysis of Variance) Simply explained
5.0 / 5 (0 votes)
Thanks for rating: