The ROC Curve (Receiver-Operating Characteristic Curve) — Topic 84 of Machine Learning Foundations
TLDRThe video script presents a detailed explanation of the Receiver Operating Characteristic (ROC) curve, a vital tool for evaluating the performance of binary classification models. It uses a simple example involving the classification of images containing or lacking a hot dog. The script outlines the process of calculating the ROC curve by adjusting the threshold for predictions and determining true positives, false negatives, true negatives, and false positives. It also explains how to calculate the True Positive Rate (TPR) and False Positive Rate (FPR) at different thresholds and how to plot these on a graph to form the ROC curve. The area under the ROC curve (AUC) is highlighted as a measure of model performance, with a higher AUC indicating better performance. The script concludes with a brief guide on the significance of the AUC and a call to action for viewers to subscribe and engage with the content.
Takeaways
- 📊 The Receiver Operating Characteristic (ROC) curve is a performance metric used for binary classification models.
- 🔢 The example in the script uses predictions about whether a hot dog is present in an image to demonstrate the calculation of the ROC curve.
- 📉 The ROC curve is created by plotting the true positive rate (TPR) against the false positive rate (FPR) at various threshold settings.
- 🎯 The TPR is calculated as the number of true positives divided by the sum of true positives and false negatives.
- ❌ The FPR is calculated as the number of false positives divided by the sum of false positives and true negatives.
- 📈 At each threshold, the algorithm's predictions are evaluated to determine true positives, false positives, true negatives, and false negatives.
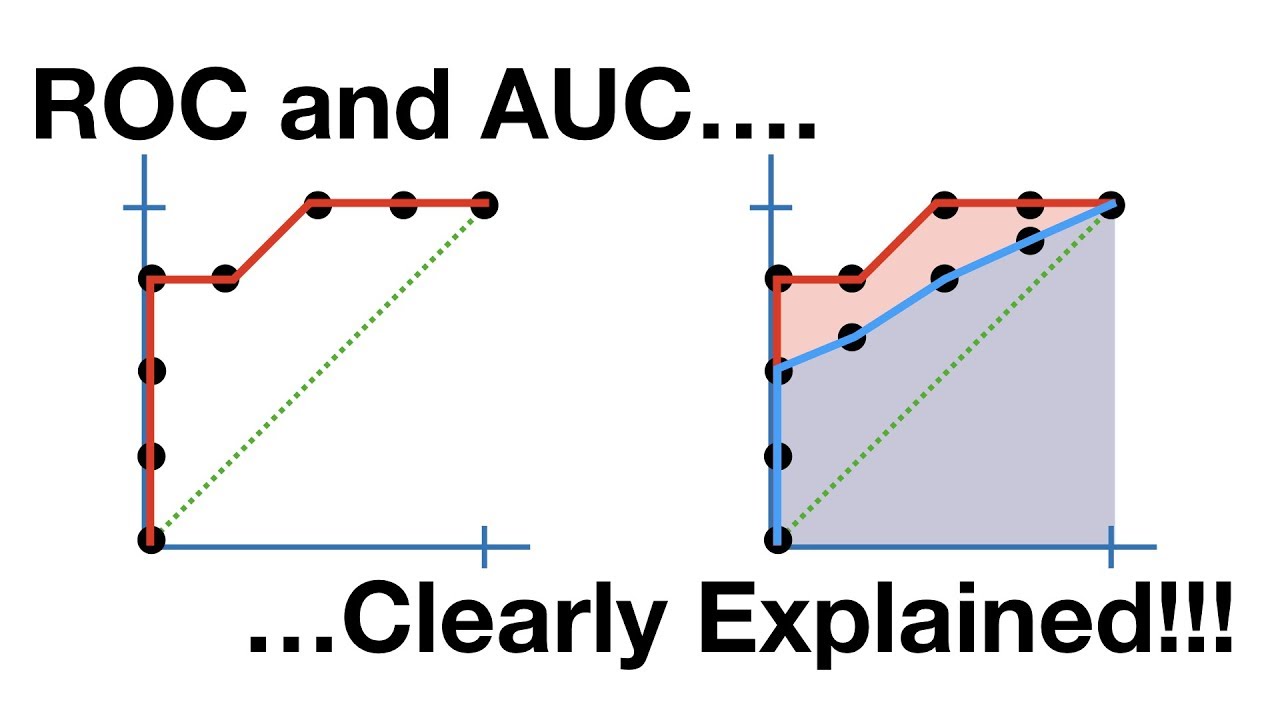
- ✅ A perfect classifier would have an ROC curve that fills the entire space under the curve, resulting in an Area Under the Curve (AUC) of 1.0.
- 🔧 The AUC of the ROC curve provides a measure of how well the classifier separates the classes; an AUC of 0.5 indicates random chance.
- 🚫 The highest threshold (0.9 in the example) is typically not used because it would classify all instances as negatives, which is not informative.
- 📋 The process of calculating the ROC curve involves considering different thresholds and evaluating the model's predictions at each threshold.
- 🧮 The area under the ROC curve can be calculated using integral calculus, which provides a nuanced view of the model's performance compared to simpler metrics like accuracy.
Q & A
What is the Receiver Operating Characteristic (ROC) curve?
-The Receiver Operating Characteristic (ROC) curve is a graphical representation used to illustrate the performance of a binary classification model. It plots the true positive rate (TPR) against the false positive rate (FPR) at various threshold settings.
Why is the ROC curve considered a useful metric?
-The ROC curve is considered useful because it provides a comprehensive view of a model's performance across all classification thresholds, allowing for a nuanced evaluation of its ability to distinguish between positive and negative classes.
What does the term 'true positive' refer to in the context of the ROC curve?
-A true positive refers to the correct identification of an instance that belongs to the positive class. In the script's example, it would be when the algorithm correctly predicts the presence of a hot dog in an image.
How is the false positive rate (FPR) calculated?
-The false positive rate is calculated by dividing the number of false positives by the sum of false positives and true negatives. It represents the proportion of negative instances that are incorrectly classified as positive.
What is the significance of the area under the ROC curve (AUC)?
-The area under the ROC curve (AUC) represents the likelihood that the model will rank a randomly chosen positive instance higher than a randomly chosen negative one. An AUC of 0.5 indicates random performance, while an AUC of 1.0 indicates perfect performance.
Why is the threshold of 0.9 not considered in the ROC curve calculation?
-The threshold of 0.9 is not considered because, at this level, the model would predict everything as negative, which would not provide any useful information for evaluating the model's performance. It is essential to have both positive and negative predictions to calculate the ROC curve.
What does the term 'false negative' mean in binary classification?
-A false negative occurs when the model incorrectly classifies a positive instance (an instance that belongs to the positive class) as negative. In the script's example, it would be when the algorithm predicts there is no hot dog in an image when there actually is one.
How does the ROC curve help in model selection?
-The ROC curve helps in model selection by allowing for a direct comparison of different models' performance across various thresholds. It provides a visual representation that can guide the choice of the model that best balances the trade-off between true positive rate and false positive rate for a given application.
What is the relationship between the true positive rate (TPR) and the false positive rate (FPR) in the context of the ROC curve?
-The true positive rate (TPR) and the false positive rate (FPR) are plotted on the Y-axis and X-axis, respectively, to create the ROC curve. As the threshold for classification changes, the TPR and FPR values change, which in turn changes the shape of the ROC curve, reflecting the model's performance.
How can one calculate the area under the ROC curve?
-The area under the ROC curve (AUC) can be calculated using integral calculus, specifically by integrating the difference between the TPR and the FPR over the range of possible thresholds. This numerical integration provides a single value that summarizes the model's overall performance.
What is the implication of a model having an AUC of 0.75 as mentioned in the script?
-An AUC of 0.75 suggests that the model has a performance that is above random chance and is correctly classifying 75% of the time when considering the trade-off between true positive rate and false positive rate. It indicates a good model performance, though not perfect.
What are the four possible outcomes in a binary classification problem?
-The four possible outcomes in a binary classification problem are true positive, true negative, false positive, and false negative. These outcomes are used to calculate the TPR and FPR, which are then plotted on the ROC curve.
Outlines
📊 Calculating the ROC Curve with Real Numbers
This paragraph explains the concept of the Receiver Operating Characteristic (ROC) curve, a vital metric for evaluating the performance of binary classification models. The script uses a simple example involving a binary classifier's predictions about the presence of hot dogs in images. It details how to calculate the ROC curve by considering different thresholds and classifying the predictions as true positives, true negatives, false positives, or false negatives. The process involves comparing the model's predicted probabilities (y hat) with the actual state (y) and adjusting the threshold to determine the classification accuracy at various confidence levels.
📈 Determining True Positive and False Positive Rates
The second paragraph delves into calculating the true positive rate (TPR) and the false positive rate (FPR) at different thresholds. The TPR is the ratio of true positives to the sum of true positives and false negatives, while the FPR is the ratio of false positives to the sum of false positives and true negatives. The script outlines how these rates are computed for various thresholds and then plotted on a curve. The resulting plot is known as the ROC curve, and the ultimate goal is to maximize the area under this curve (AUC-ROC), which indicates the model's performance. An AUC-ROC of 0.5 suggests random performance, while an AUC-ROC of 1.0 indicates a perfect classifier.
📝 Additional Resources and Contact Information
The final paragraph provides supplementary information for viewers interested in further learning about machine learning. It offers guidance on where to subscribe to the channel for more videos in the series, how to sign up for an email newsletter at johncrone.com, and the option to connect with the presenter on LinkedIn. It also mentions the presenter's Twitter account for those who prefer following on social media. This paragraph serves as a call to action for engagement and continued learning.
Mindmap
Keywords
💡Receiver Operating Characteristic (ROC) Curve
💡Binary Classification Model
💡True Positive (TP)
💡False Positive (FP)
💡True Negative (TN)
💡False Negative (FN)
💡Threshold
💡True Positive Rate (TPR)
💡False Positive Rate (FPR)
💡Area Under the Curve (AUC)
💡Integral Calculus
Highlights
The video demonstrates how to calculate the Receiver Operating Characteristic (ROC) curve, a metric for evaluating binary classification models.
An example with real numbers is used to illustrate the process, focusing on a binary classifier that predicts the presence of a hot dog in images.
The true state of the world (hot dog present or not) is represented by labels 1 and 0, while the model's predictions are outputs ranging from least to most confidence.
The calculation of the ROC curve involves considering different threshold values to determine classifications of positive or negative.
At each threshold, the algorithm's predictions are evaluated for true positives, true negatives, false positives, and false negatives.
The threshold of 0.3 is used as the first example to classify images as containing or not containing a hot dog.
The video explains why the highest threshold (0.9) is not considered, as it would classify all cases as negative.
The true positive rate (TPR) and false positive rate (FPR) are calculated for each threshold to quantify the model's performance.
The TPR is the number of true positives divided by the sum of true positives and false negatives.
The FPR is determined by the number of false positives over the sum of false positives and true negatives.
The ROC curve is plotted with the TPR on the Y-axis and the FPR on the X-axis, showing the model's performance across different thresholds.
The area under the ROC curve (AUC) is a measure of the model's ability to distinguish between positive and negative cases.
An AUC of 0.5 indicates random performance, while an AUC of 1.0 represents a perfect classifier.
The video provides a guide on how to interpret the AUC, with values greater than 0.5 indicating better-than-chance performance.
Integral calculus is mentioned as a method to calculate the area under the ROC curve.
The ROC curve is considered more nuanced and informative than simpler metrics like classification accuracy.
The tutorial emphasizes the importance of understanding the ROC curve for evaluating and comparing binary classification models.
The presenter encourages viewers to subscribe for more content on machine learning and offers various ways to stay connected.
Transcripts


5.0 / 5 (0 votes)
Thanks for rating: