2610 Chapter 8 Day 2
TLDRThe video script is a detailed instructional guide for students on constructing confidence intervals in statistics. It covers various scenarios, including when the population standard deviation is known or unknown, and when the sample size meets certain conditions. The instructor emphasizes the importance of understanding the central limit theorem, using technology tools like applets for calculations, and correctly interpreting confidence intervals in context. The session also includes practical examples, such as estimating the average hours of sleep with hypnotherapy and the proportion of adults with cell phones, to apply the theoretical concepts.
Takeaways
- 📚 Start by opening the textbook to section 8.1 and work through example 8.3 to find the average of a dataset and construct a 98% confidence interval for specific absorption rates of cell phones, assuming a population standard deviation of 337.
- 🔍 Remember to include a picture, formula, numbers, and an interpretation in your solution to ensure a complete understanding of the context and results.
- 📈 Utilize the central limit theorem (CLT) when the sample size is 30 or more to justify the use of a normal distribution for the sampling distribution of the sample mean.
- 🧩 Pay attention to the details in the problem, such as noting the sample size, which is crucial for understanding the distribution and calculations involved.
- 📉 When the population standard deviation (Sigma) is known, use the Z-distribution for constructing confidence intervals; otherwise, use the T-distribution if Sigma is unknown.
- 📝 Calculate the standard error (SE) as the standard deviation of the sampling distribution, which is Sigma over the square root of the sample size (n).
- 📊 Use technology tools like applets to find Z-scores or T-scores for specific confidence levels, which simplifies the process and reduces the need for manual lookups.
- 🔢 Understand the difference between margin of error and interval width, and how they relate to the confidence level and sample size in statistical analysis.
- 📐 Practice is essential for becoming proficient in using statistical tools and interpreting the results within the context of the problem.
- 📝 Always include an interpretation of the confidence interval in context, clarifying that it is not a probability statement but an estimate based on the sample data.
- 🔄 When calculating for a confidence interval, ensure to follow the process of calculating the sample mean, determining the appropriate distribution (Z or T), finding the critical value, calculating the standard error, and then constructing the interval with the correct interpretation.
Q & A
What is the main task the instructor assigns to the students at the beginning of the script?
-The main task is to work in groups, open the textbook to section 8.1, find example 8.3, calculate the average of the dataset, and construct a 98% confidence interval for the true population mean of specific absorption rates for cell phones, assuming a population standard deviation of 337.
What is the importance of the number 30 in the context of the script?
-The number 30 is significant because it represents the sample size (n), which is important for calculating the mean and understanding the distribution of sample averages due to the Central Limit Theorem (CLT).
What is the Central Limit Theorem (CLT), and why is it mentioned in the script?
-The Central Limit Theorem (CLT) states that the distribution of sample means will be approximately normal if the sample size is large enough (n ≥ 30), regardless of the shape of the population distribution. It is mentioned because it justifies the use of the normal distribution for constructing the confidence interval.
What is the formula for calculating the standard error (SE) in the context of the script?
-The standard error (SE) is calculated as the population standard deviation (Sigma) divided by the square root of the sample size (n), or SE = Sigma / √n.
How does the instructor explain the process of finding the Z-score for a 98% confidence interval?
-The instructor guides students to use an online applet for the normal curve, inputting 0.01 for the tail probability to find the Z-score, which represents the number of standard deviations from the mean that corresponds to the desired confidence level.
What is the correct interpretation of a confidence interval according to the script?
-A correct interpretation is that the researcher is 98% confident that the true average specific absorption rate for the population is within the calculated interval. It is not a probability that the true mean lies within the interval but rather a statement of confidence based on the sample data.
What is the purpose of constructing a confidence interval for the mean number of hours slept with hypnotherapy?
-The purpose is to estimate the true average number of hours slept for the entire population of subjects who use hypnotherapy, with a certain level of confidence (e.g., 90%).
Why is it incorrect to say there is a 90% chance that the true population mean lies within the calculated interval?
-It is incorrect because a confidence interval does not represent a probability of the true mean being within the interval. Instead, it represents the degree of confidence that the interval contains the true mean based on the sample data.
What is the difference between a confidence interval and a binomial distribution as described in the script?
-A confidence interval is used to estimate a population parameter (e.g., mean or proportion) with a certain level of confidence, while a binomial distribution is used for scenarios with only two outcomes (success or failure), where the probability of success is constant and each trial is independent.
How does the script explain the conditions for a binomial distribution to be approximated by a normal distribution?
-The script explains that a binomial distribution can be approximated by a normal distribution if np (number of successes) and nq (number of failures) are both at least 5, meaning there are at least five successes and five failures in the sample.
What is the formula for calculating the standard error of a sampling proportion (p-hat) in the script?
-The standard error of a sampling proportion (p-hat) is calculated as the square root of (p-hat * q-hat) / n, where p-hat is the sample proportion, q-hat is one minus the sample proportion, and n is the sample size.
Outlines
📚 Group Work and Textbook Exercise Overview
Instructing students to work in groups, the speaker introduces an activity involving Stat.BL and an online textbook. The task is to access section 8.1 and example 8.3, where students are to find the average of a dataset and construct a 98% confidence interval for the true population mean of specific absorption rates for cell phones, using a given population standard deviation. The speaker emphasizes the importance of understanding the central limit theorem (CLT) and correctly applying it to justify the normal distribution of the sampling distribution of averages.
📉 Calculating the Confidence Interval and Standard Error
The speaker continues with the process of calculating a 98% confidence interval, explaining the concept of standard error and its importance. The calculation involves using the Z-distribution with a Z-score corresponding to the desired confidence level. The speaker uses an applet to find the Z-score for a 0.01 tail area and demonstrates the calculation of the margin of error. The summary also covers the correct interpretation of confidence intervals in context, avoiding common misunderstandings about probability.
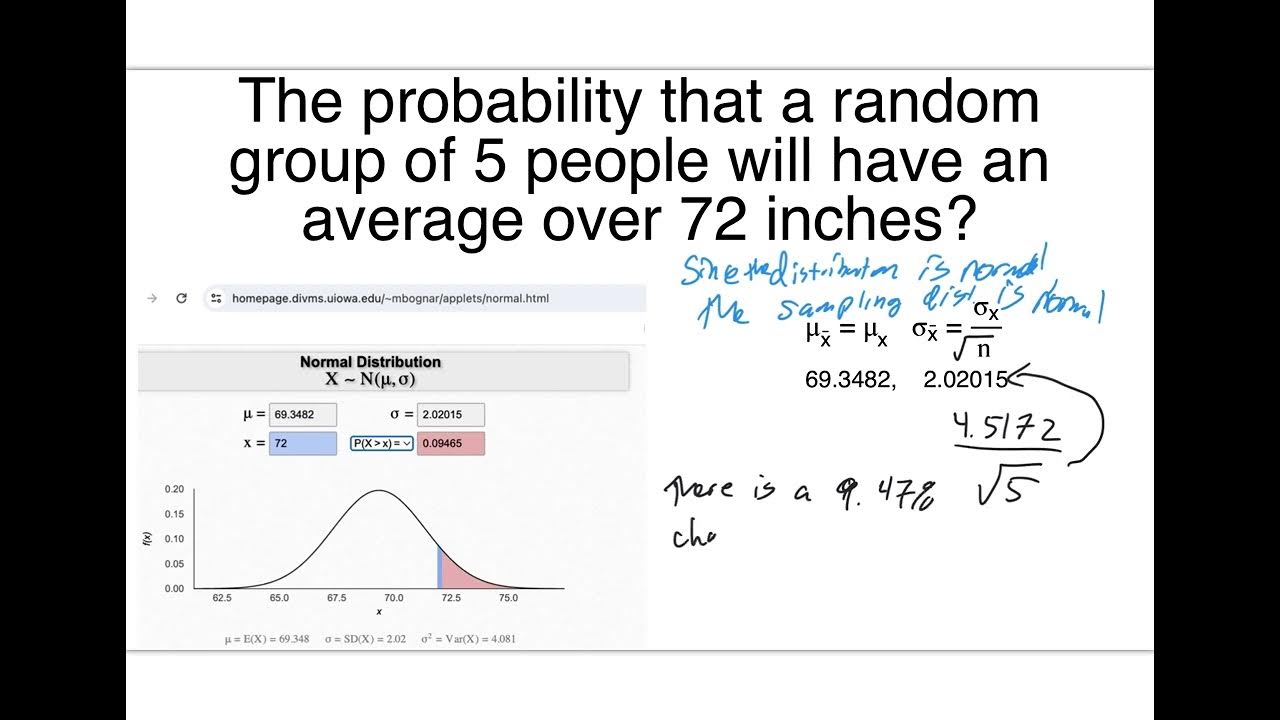
🏀 Determining Sample Size for Basketball Players' Heights
This section discusses how to determine the necessary sample size to ensure a 95% confidence interval with a margin of error within one inch for the average height of basketball players. The speaker explains the relationship between the margin of error, standard error, and sample size, using the Z-distribution and the central limit theorem. The process involves calculating the required sample size using the known standard deviation and desired margin of error, emphasizing the importance of the normal distribution assumption.
🔢 Hypnotherapy Study and Confidence Interval Construction
The speaker presents a hypothetical study on the effects of hypnotherapy on sleep habits, aiming to construct a 90% confidence interval for the mean number of hours slept. The process involves calculating the standard deviation from a given dataset and using it to find the standard error. The speaker then demonstrates how to use an online applet to calculate the T-value for the confidence interval, given that the population standard deviation is unknown, and explains the difference between using the Z-distribution and the T-distribution.
📉 Misinterpretation of Confidence Intervals and Correct Approach
The speaker critiques an incorrect interpretation of a confidence interval found in an applet, emphasizing that a confidence interval does not represent a probability of containing the true mean. Instead, the correct interpretation involves either repeated sampling or the confidence level associated with the interval. The speaker also introduces the conditions for a binomial distribution and how it relates to constructing confidence intervals for proportions.
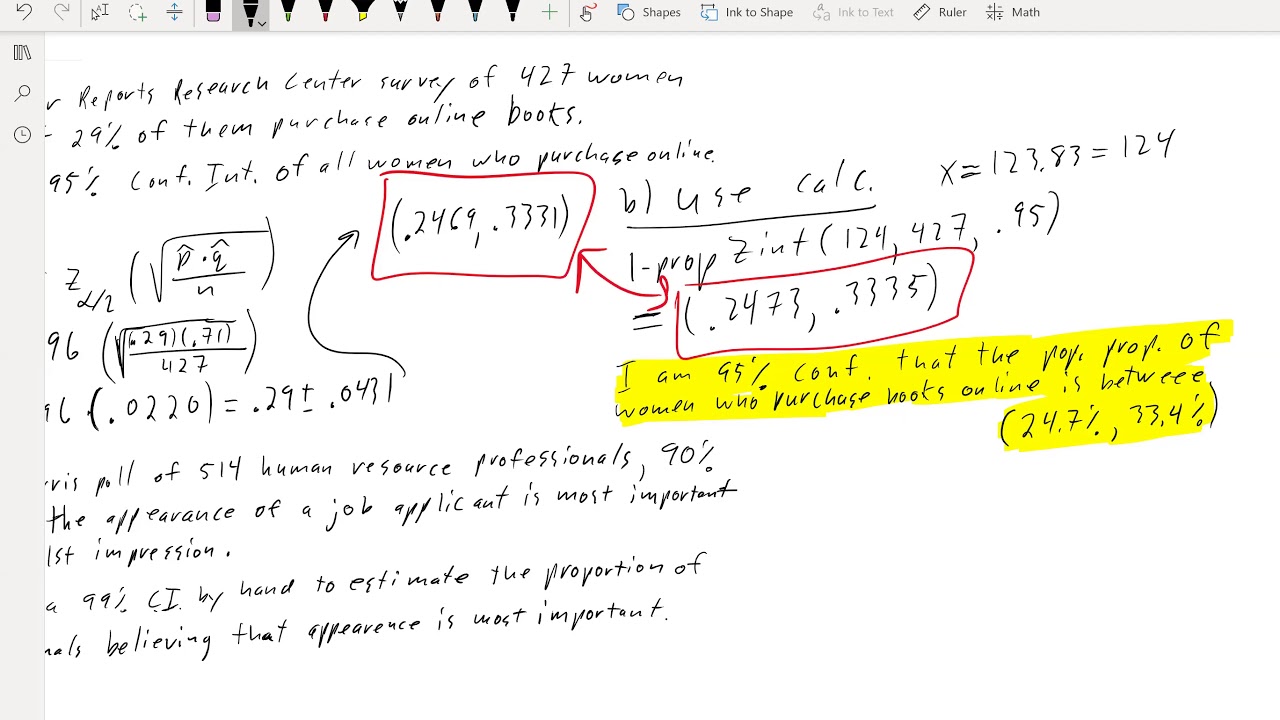
📝 Estimating Proportions and Confidence Intervals for Binomial Distributions
The final paragraph focuses on estimating proportions using a binomial distribution, where the conditions of the binomial (fixed number of trials, constant probability of success, and independence of trials) are met. The speaker explains how to calculate a confidence interval for a sampling proportion, given that the product of the sample size and both the success and failure probabilities is at least five, allowing for a normal approximation of the distribution of the sample proportion.
Mindmap
Keywords
💡StatBlue
💡Confidence Interval
💡Central Limit Theorem (CLT)
💡Standard Deviation
💡Standard Error
💡Z-distribution
💡T-distribution
💡Degrees of Freedom
💡Sampling Distribution
💡Hypnotherapy
💡Binomial Distribution
Highlights
Groups are instructed to use StatBlue and online textbooks for data analysis.
Emphasis on connecting data pieces and utilizing textbook section 8.1 for a confidence interval calculation.
Students are tasked with finding the average of a dataset and constructing a 98% confidence interval for specific absorption rates.
Explanation of the importance of the sample size in determining the distribution's normality through the Central Limit Theorem.
Clarification on the use of Z-distribution due to the known population standard deviation.
Demonstration of calculating the standard error and its role in constructing confidence intervals.
The process of finding the Z-score for a 98% confidence interval using an online applet.
Misinterpretation of confidence intervals as probabilities is corrected, emphasizing their true meaning.
Differentiation between interval width and margin of error in the context of confidence intervals.
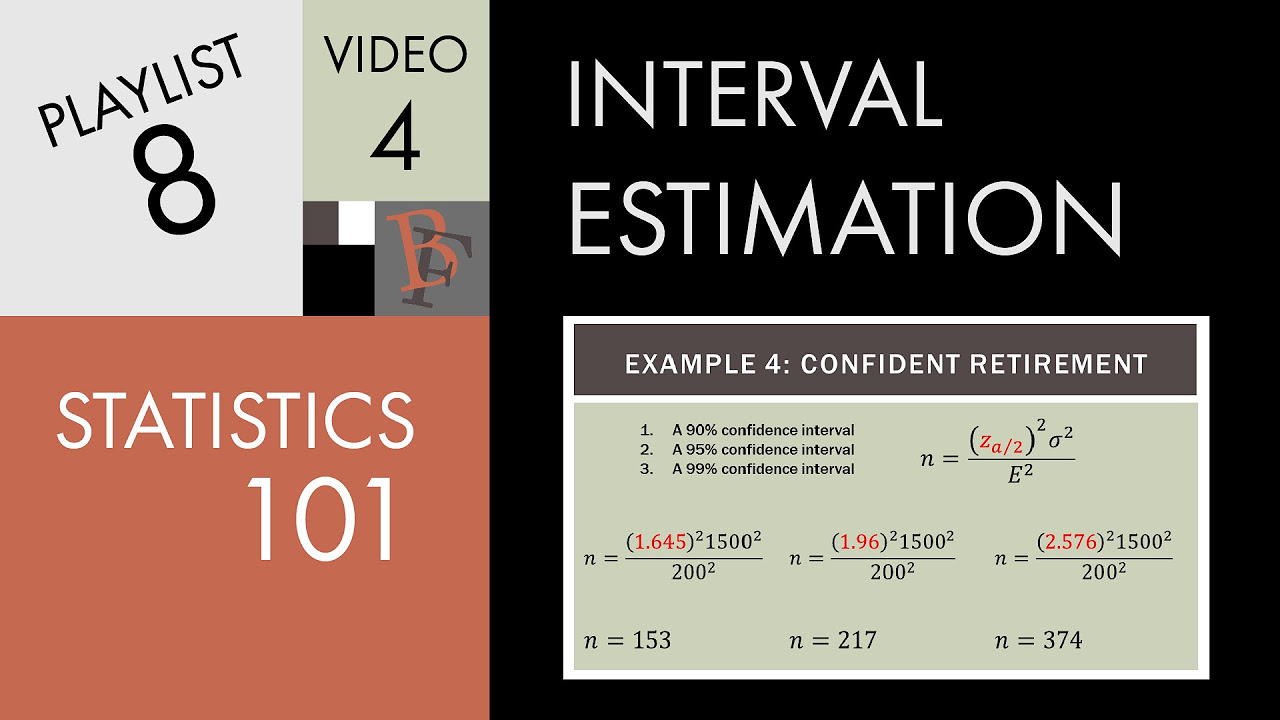
Introduction of the concept of estimating the necessary sample size for a given margin of error.
Assumption of normal distribution in the population of basketball players' heights for statistical analysis.
Use of the T-distribution when the population standard deviation is unknown, contrasting with the Z-distribution.
Explanation of degrees of freedom in the context of T-distributions and their calculation.
Guidance on interpreting T-distribution tables for finding critical values.
Critique of a poor example in an applet that incorrectly frames confidence intervals in terms of probability.
Final remarks on the importance of correct interpretation of confidence intervals in statistical analysis.
Transcripts
Browse More Related Video
2610 Chapter 8 Day 1

Elementary Statistics - Chapter 7 - Estimating Parameters and Determining Sample Sizes Part 2
Math 119 Chap 7 part 2

AP Statistics Chapter 8 In-Depth Review Video
Statistics 101: Confidence Intervals, Estimating Sample Size Needed
7.2.0 Estimating a Population Mean - Lesson Overview, Key Concepts, Learning Outcomes
5.0 / 5 (0 votes)
Thanks for rating: