10.2.4 Regression - Outliers and Influential Points
TLDRIn this video, we discussed learning outcome number four for lesson 10.2, focusing on outliers and influential points in scatter plots. The goal was to help viewers define and identify outliers and influential points. We explained that an outlier is a point far from other data points, while an influential point significantly affects the regression line. We used an example involving chocolate consumption and Nobel laureates to illustrate these concepts. The video emphasized using tools like Excel to graph regression lines and determine the impact of individual data points. The session concluded with a preview of the next topic, the least squares property.
Takeaways
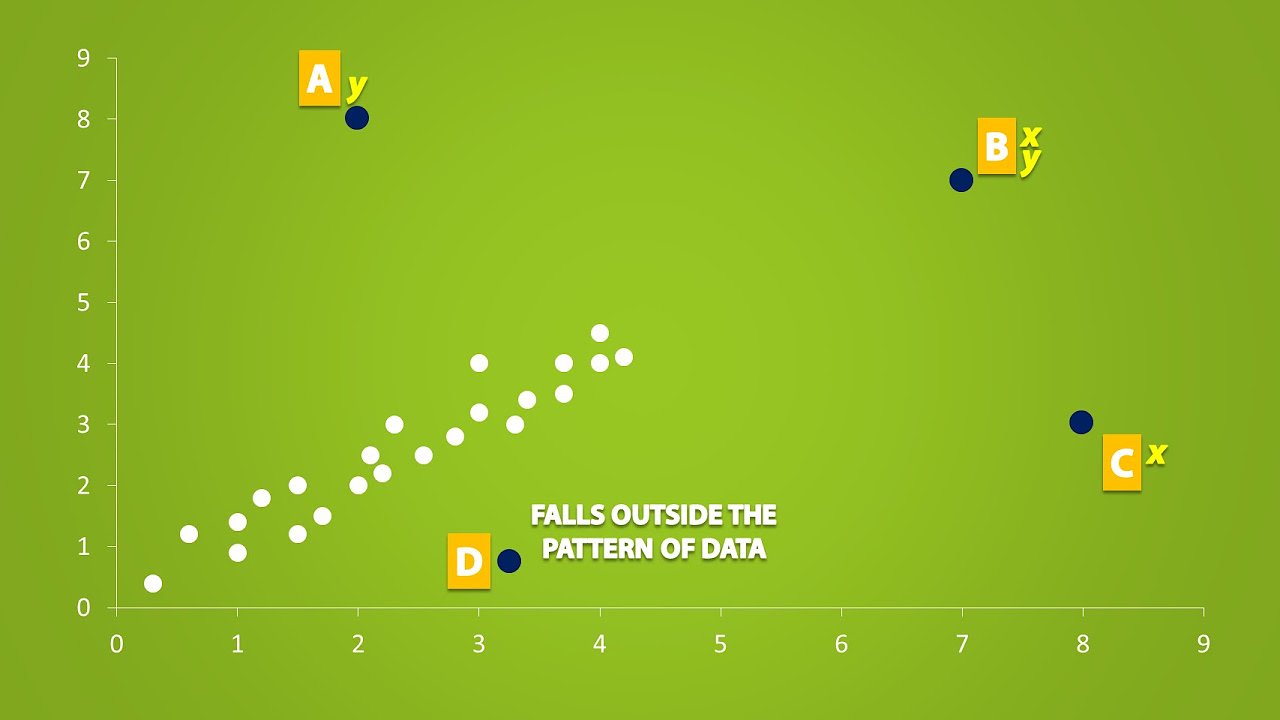
- 📌 Outliers are data points that lie far away from the rest of the data in a scatter plot, and identifying them can be somewhat subjective.
- 🔍 Influential points are those that have a strong effect on the graph of the regression line, altering its slope and intercept significantly.
- 📈 To determine if a point is influential, one should compare the regression line with and without the point in question on the same scatter plot.
- 🛠 The use of tools like Excel can facilitate the creation of scatter plots and regression lines to identify outliers and influential points.
- 🍫 An example given in the script involves chocolate consumption and Nobel laureate rates, where adding a point can dramatically change the regression line.
- 📊 The point (50, 0) is identified as both an influential point and an outlier due to its distance from other data points and its effect on the regression line.
- 🤔 The distinction between an outlier and an influential point can sometimes be unclear, requiring visual inspection and comparison of regression lines.
- 📉 The script emphasizes that the identification of outliers is subjective and may vary between individuals viewing the same data set.
- 📚 The class does not delve into specific rules for identifying outliers, instead focusing on the conceptual understanding of what constitutes an outlier.
- 🔑 The importance of visual representation is highlighted, as it can clearly show the impact of an influential point on the regression line.
- 🔜 The script concludes with a teaser for the next lesson, which will discuss the least squares property and how it measures the 'best fit' of a regression line.
Q & A
What is the main focus of the video script?
-The video script focuses on explaining the concepts of outliers and influential points in the context of scatter plots and regression lines.
How is an outlier defined in the context of a scatter plot?
-An outlier is defined as a point that lies far away from all the other data points in a scatter plot, making it visually distinct from the rest of the data.
What is the subjectivity involved in identifying an outlier?
-Identifying an outlier can be somewhat subjective, as different people might have different perceptions of what 'far away' means in terms of data points' distance from each other.
What is an influential point in the context of regression analysis?
-An influential point is a data point that strongly affects the graph of the regression line, causing significant changes in the line's slope or position when included or excluded from the analysis.
How can you determine if a point is an influential point?
-To determine if a point is influential, one should graph the regression line on a scatter plot both with and without the point in question, and observe if there are dramatic changes in the regression line.
What tool is suggested for creating scatter plots and graphing regression lines?
-The script suggests using a tool like Excel, which allows for quick creation of scatter plots and graphing of regression lines.
What is the example given in the script to illustrate an influential point?
-The example given is the 23 pairs of chocolate consumption and Nobel laureate rate data, where adding a point (50, 0) dramatically changes the regression line, indicating it is an influential point.
Why is the point (50, 0) considered both an influential point and an outlier in the example?
-The point (50, 0) is considered both an influential point and an outlier because it significantly changes the regression line when included and is visually far away from all other data points in the scatter plot.
What is the least squares property mentioned at the end of the script?
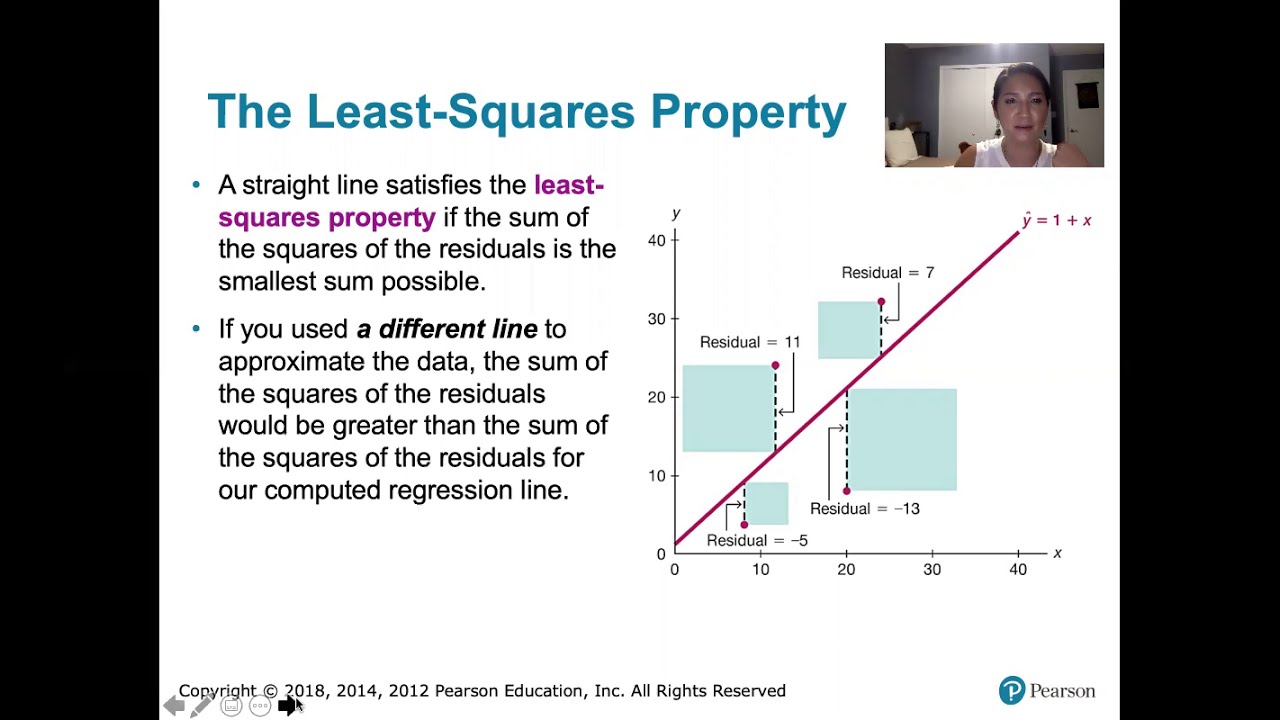
-The least squares property refers to the method used to determine the best fit line in regression analysis, which minimizes the sum of the squares of the differences between the observed values and the values predicted by the model.
What will be the topic of the next video in the series?
-The next video will discuss the least squares property in more detail, explaining how the best fit line for a set of data is measured and determined.
Outlines
📊 Understanding Outliers and Influential Points
This paragraph introduces the concept of outliers and influential points in the context of a scatter plot. An outlier is defined as a data point that is significantly distant from the rest of the data, and its identification can be somewhat subjective. Influential points, on the other hand, are those that have a strong impact on the regression line's graph. To determine if a point is influential, one should compare the regression lines with and without the point in question. The example provided involves chocolate consumption and Nobel laureate rates, demonstrating how the inclusion of a particular point can dramatically alter the regression line, thus identifying it as both an outlier and an influential point.
📈 Confirming Influential Points with Regression Analysis
The second paragraph delves deeper into identifying influential points by emphasizing the necessity of graphing the regression line on a scatter plot both with and without the suspect point. It suggests using tools like Excel for this purpose. The paragraph concludes by reiterating the importance of the least squares property, which will be discussed in a subsequent video, as a method to measure the 'best fit' of the regression line to the data.
Mindmap
Keywords
💡Outliers
💡Influential Points
💡Scatter Plot
💡Regression Line
💡Paired Sample Data
💡Subjective
💡Excel
💡Least Squares Property
💡Nobel Laureate Rate
💡Chocolate Consumption
Highlights
The video discusses learning outcome number four for lesson 10.2, focusing on outliers and influential points.
The goal is to define outliers and influential points and determine their presence in a scatter plot.
An outlier is defined as a point that lies far away from other data points in a scatter plot.
Identifying an outlier can be subjective, depending on individual perception of what is 'far away'.
Influential points are those that significantly affect the regression line graph.
To determine if a point is influential, compare regression lines with and without the point.
Dramatic changes in the regression line indicate an influential point.
Excel can be used to easily create scatter plots and graph regression lines for analysis.
An example using chocolate consumption and Nobel laureate rate data illustrates the concept.
The inclusion of a point (50, 0) dramatically changes the regression line, indicating it is influential.
The point (50, 0) is also an outlier due to its distance from other data points.
The subjective nature of identifying outliers is discussed, with some points being more clearly outliers than others.
The video emphasizes the importance of graphing regression lines with and without a point to determine its influence.
The next video will discuss the least squares property and what it means for a line to be the best fit.
The least squares property will be the focus of learning outcome number five.
The video concludes with a preview of the next topic, leaving the audience curious about the least squares property.
Transcripts
Browse More Related Video
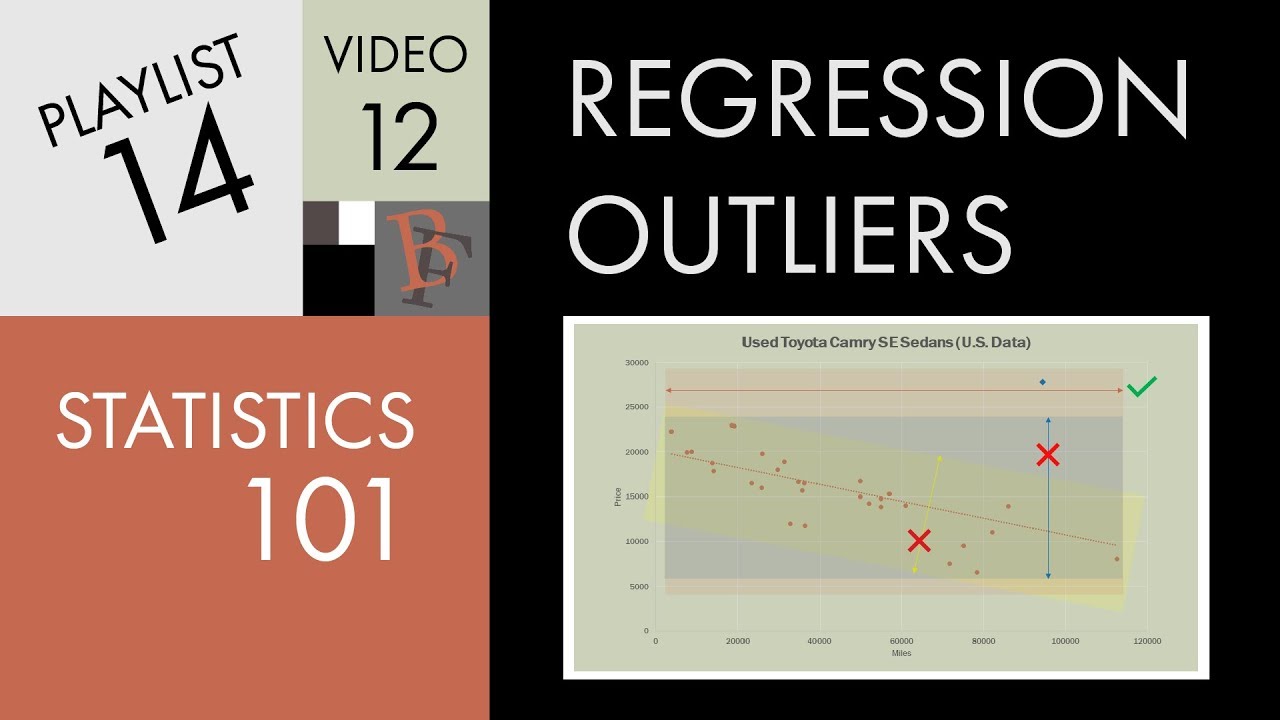
Statistics 101: Linear Regression, Outliers and Influential Observations
The Effects of Outliers and Extrapolation on Regression (2.4)
10.2.5 Regression - Residuals and the Least-Squares Property

10.2.0 Regression - Lesson Overview, Key Concepts, and Learning Outcomes
Introduction to residuals and least squares regression
Math 119 Chapter 10 part 2
5.0 / 5 (0 votes)
Thanks for rating: