The Effects of Outliers and Extrapolation on Regression (2.4)
TLDRThis video script delves into the concepts of extrapolation and outliers in the context of data analysis and regression. Extrapolation refers to making predictions beyond the known range of data, which should be avoided due to potential inaccuracies, as demonstrated with a GPA prediction example. Outliers, data points distant from the rest of the dataset, can significantly impact the regression line, especially those in the X direction. The script explains how outliers can skew the analysis and the importance of recognizing influential data points that drastically alter the regression line's position.
Takeaways
- 📊 Extrapolation is the process of making predictions outside the known range of data.
- 🚫 Extrapolations should be avoided when possible, as they may not accurately represent the relationship between variables.
- 📈 The video uses a graph to predict a student's GPA based on the number of hours studied per week, with x representing study hours and y representing GPA.
- 🎓 A GPA prediction of 6.1 for 15 hours of study per week is an example of extrapolation, which is problematic since the highest possible GPA is 4.5.
- 🔍 Outliers are data points that are numerically distant from the rest of the data set, either in the x-direction, y-direction, or both.
- 📐 The range of a data set refers to the interval between the minimum and maximum values, and outliers fall outside of this interval.
- 🤔 Outliers can significantly affect the position of a regression line, especially those in the x-direction.
- 🔄 Including an outlier in the y-direction results in only a slight shift of the regression line.
- ⚠️ Influential outliers, like those in both x and y directions, can drastically change the position of the regression line.
- 📊 A bivariate outlier is a data point that falls outside the pattern of the data, not necessarily in the x or y direction, but still impacts the overall data distribution.
- 🧐 The presence and influence of outliers should be carefully considered when analyzing data and fitting regression lines to avoid misleading results.
Q & A
What is the main topic of the video?
-The main topic of the video is the concept of extrapolation and the impact of outliers on regression analysis.
What does extrapolation refer to in the context of the video?
-Extrapolation refers to making predictions outside the range of data, such as predicting a student's GPA based on hours studied when the hours are outside the observed range.
Why should extrapolations be avoided if possible?
-Extrapolations should be avoided because they are made outside the known range of data, and we cannot be certain if the relationship between variables continues to exist beyond that range.
What is the highest GPA a student can get according to the video?
-According to the video, the highest GPA a student can get is 4.5.
What are outliers in the context of regression analysis?
-Outliers are data points that are numerically distant from the rest of the data set, either in the X direction, Y direction, or both.
How does the presence of outliers affect the position of a regression line?
-Outliers, especially those in the X direction, can greatly influence the position of a regression line, potentially causing it to shift significantly.
What is the difference between an outlier in the X direction and an outlier in the Y direction?
-An outlier in the X direction is a data point with an X value that falls outside the observed range of X values, while an outlier in the Y direction has a Y value outside the observed range of Y values.
What is a bivariate outlier?
-A bivariate outlier is a data point that falls outside the observed range in both the X and Y directions.
How does including an outlier affect the regression line?
-Including an outlier can cause the regression line to shift or change its position, especially if the outlier is in the X direction or is a bivariate outlier.
What is the significance of the point that falls outside the pattern of data points but not an outlier in the X or Y direction?
-The point that falls outside the pattern but is not an outlier in the X or Y direction, known as Point D, indicates a potential anomaly or a deviation from the general trend that may require further investigation.
How does the video demonstrate the concept of extrapolation and outliers?
-The video uses a graph to illustrate the concept of extrapolation by showing predictions outside the observed range of data and identifies outliers by their positions relative to the main data set.
Outlines
📊 Understanding Extrapolation and Outliers in Regression Analysis
This paragraph introduces the concepts of extrapolation and outliers in the context of regression analysis. Extrapolation refers to making predictions outside the known range of data, which should be avoided if possible due to the uncertainty of the relationship's continuation beyond the data range. The example given discusses predicting a student's GPA based on weekly study hours, highlighting the issue of predicting a GPA of 6.1 for a 15-hour study week, which is impossible since the highest GPA is 4.5. The paragraph also explains the impact of outliers on regression, differentiating between outliers in the X direction (data points with extreme values along the independent variable) and the Y direction (data points with extreme values along the dependent variable). It emphasizes that outliers in the X direction can significantly influence the position of the regression line, while outliers in the Y direction have minimal effect. The identification of influential outliers, like point C, is crucial as they can drastically alter the regression line's position.
🔍 Analyzing the Effects of Bivariate Outliers on Regression Lines
This paragraph delves deeper into the effects of bivariate outliers on regression lines. It clarifies that while point B is an outlier in both the X and Y directions, its position within the original regression line means it has a minimal impact on the new regression line's position. The paragraph also discusses the case of a bivariate outlier, which does not significantly affect the regression line unless it is an outlier in either the X or Y direction. The discussion serves to highlight the importance of identifying and addressing outliers in data analysis to ensure accurate and reliable predictions.
Mindmap
Keywords
💡Extrapolation
💡Outliers
💡Regression Line
💡GPA
💡Data Set
💡Bivariate Outlier
💡Influential Outliers
💡X and Y Directions
💡Predictive Modeling
💡Data Range
💡Statistical Analysis
Highlights
Extrapolation is making predictions outside the known range of data.
In the example, x is used to predict y, such as studying hours to predict a student's GPA.
The data set covers the range for valid predictions, avoiding extrapolation.
Predictions outside the data range, like a 15-hour study week leading to a 6.1 GPA, can be problematic due to unrealistic outcomes.
The highest possible GPA is 4.5, making predictions above this value invalid.
Outliers are data points numerically distant from the rest of the data set.
Outliers can be distant in the x direction, y direction, or both.
The range for the data set is defined by the minimum and maximum values.
An outlier in the x direction has an x value outside the interval between the min and max x values.
Point A is an outlier in the y direction, while points B and C are outliers in the x direction.
Point B is an outlier in both x and y directions but falls within the original regression line.
Outliers in the x direction greatly influence the position of the regression line.
Including an x-direction outlier like point C drastically changes the regression line's position.
Outliers can be influential or non-influential based on their impact on the regression line.
Bivariate outliers like point D fall outside the pattern of data points but are not outliers in the x or y direction.
The presence of outliers affects the position of the regression line, with x-direction outliers having a more significant impact.
Without outliers, the regression line would be more representative of the general trend.
Including y-direction outliers results in only a slight shift in the regression line.
The video emphasizes the importance of understanding and handling extrapolation and outliers in data analysis.
Transcripts
Browse More Related Video
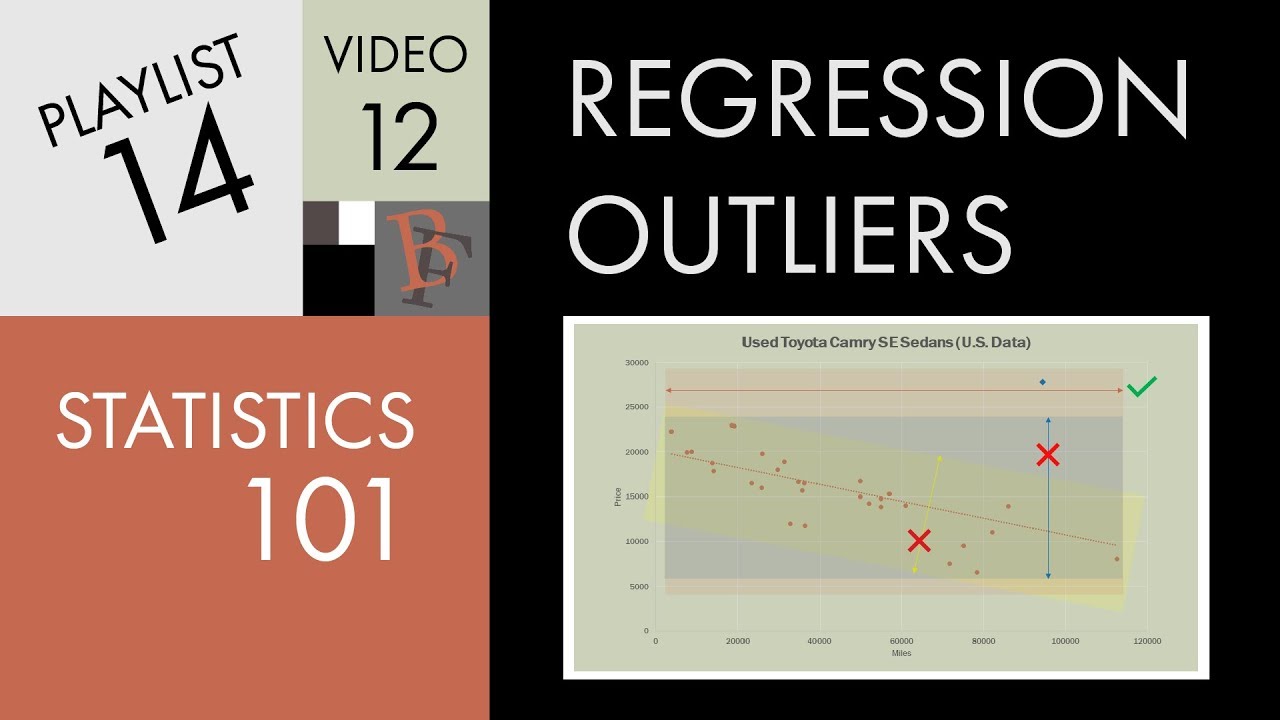
Statistics 101: Linear Regression, Outliers and Influential Observations

10.2.4 Regression - Outliers and Influential Points
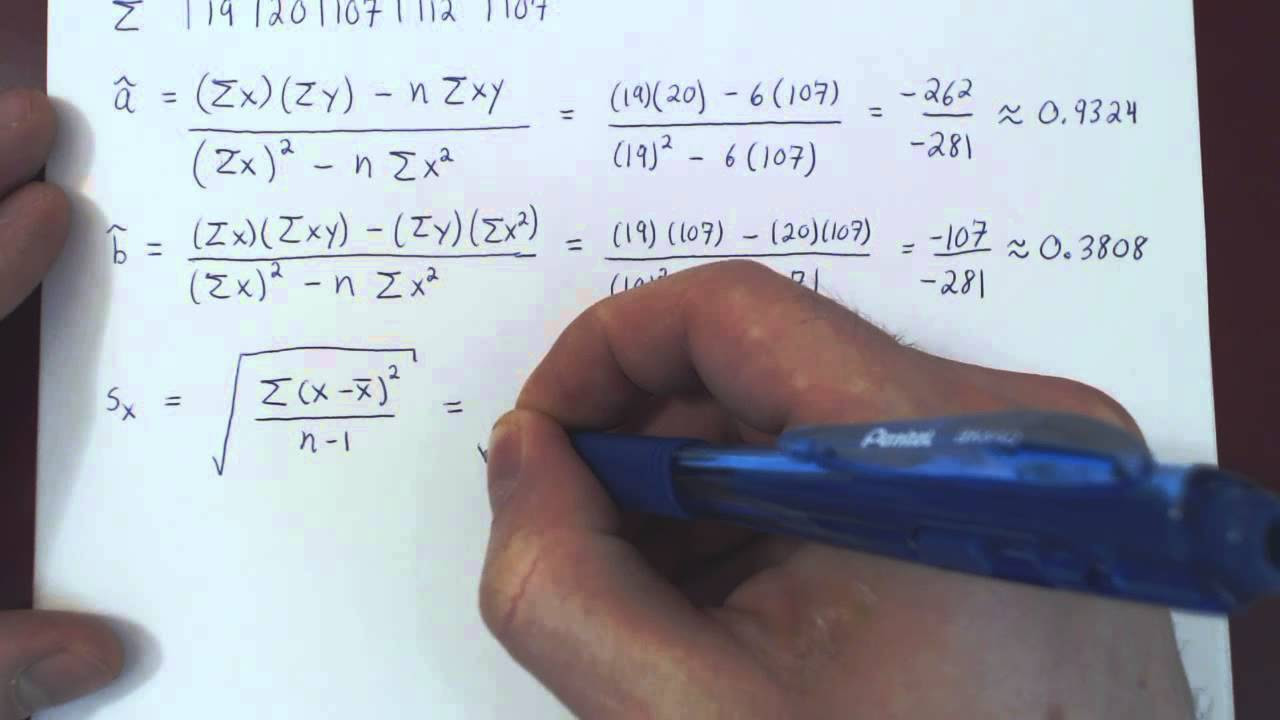
Linear Regression and Correlation - Example

RESIDUALS! What are they? how to find them, how to use them
Math 119 Chapter 10 part 2

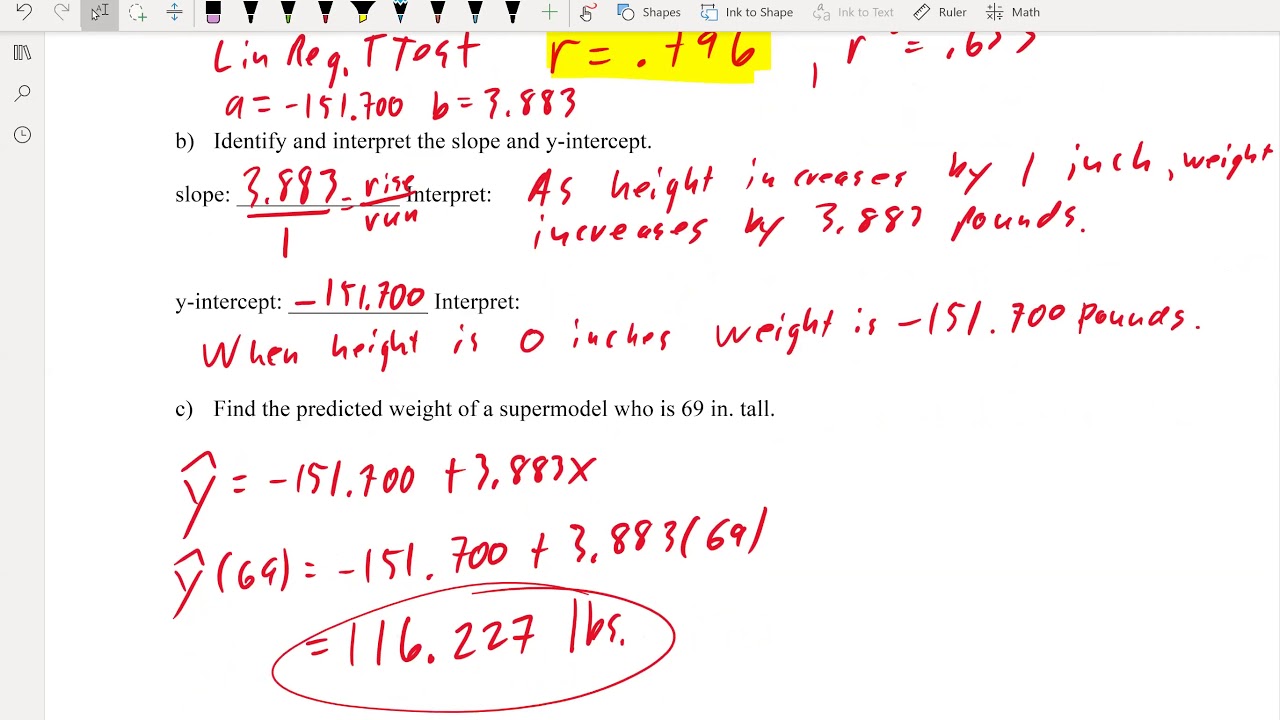
Pre-Calculus - Find the linear regression line using the TI-83/84 calculator (2)
5.0 / 5 (0 votes)
Thanks for rating: