8.2.3 Testing a Claim About a Proportion - Exact Method Using the Binomial Distribution
TLDRThis video script delves into the binomial distribution method, also known as the exact method, for testing claims about proportions without relying on normal approximations. It covers the process of verifying requirements, setting up null and alternative hypotheses, and calculating exact binomial probabilities using technology like Excel to avoid tedious manual computation. The script illustrates the method with an example involving NFC teams winning the Super Bowl and compares the exact method's p-value to that obtained using normal approximation, demonstrating consistent results despite different probabilities.
Takeaways
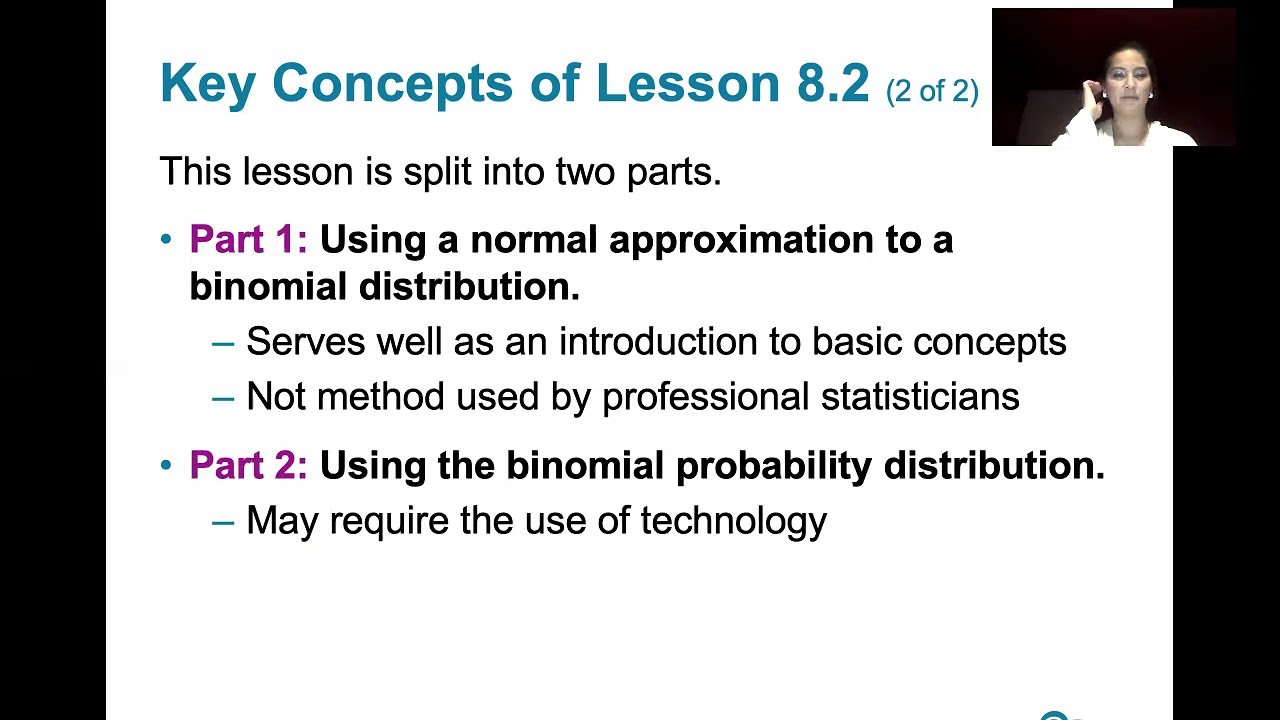
- 📚 The video continues the study of testing claims about a proportion using the binomial distribution method, also known as the exact method, as opposed to the normal approximation methods covered in part one.
- 🔍 The exact method provides a precise calculation of probabilities without relying on approximations, which is ideal when an exact answer is preferred or necessary.
- 📉 The script explains that computing binomial probabilities by hand is very time-consuming, and thus, the use of technology like Excel is recommended for efficiency.
- 📝 The video outlines the steps for the exact method, emphasizing the importance of verifying the requirements for a binomial distribution and identifying the null and alternative hypotheses.
- 🎯 The requirements for using the exact method include having a simple random sample, a fixed number of trials, two outcomes per trial (success/failure), independent trials, and a constant probability of success across trials.
- 📈 The script demonstrates how to use Excel to quickly calculate binomial probabilities for various numbers of successes, simplifying the process significantly.
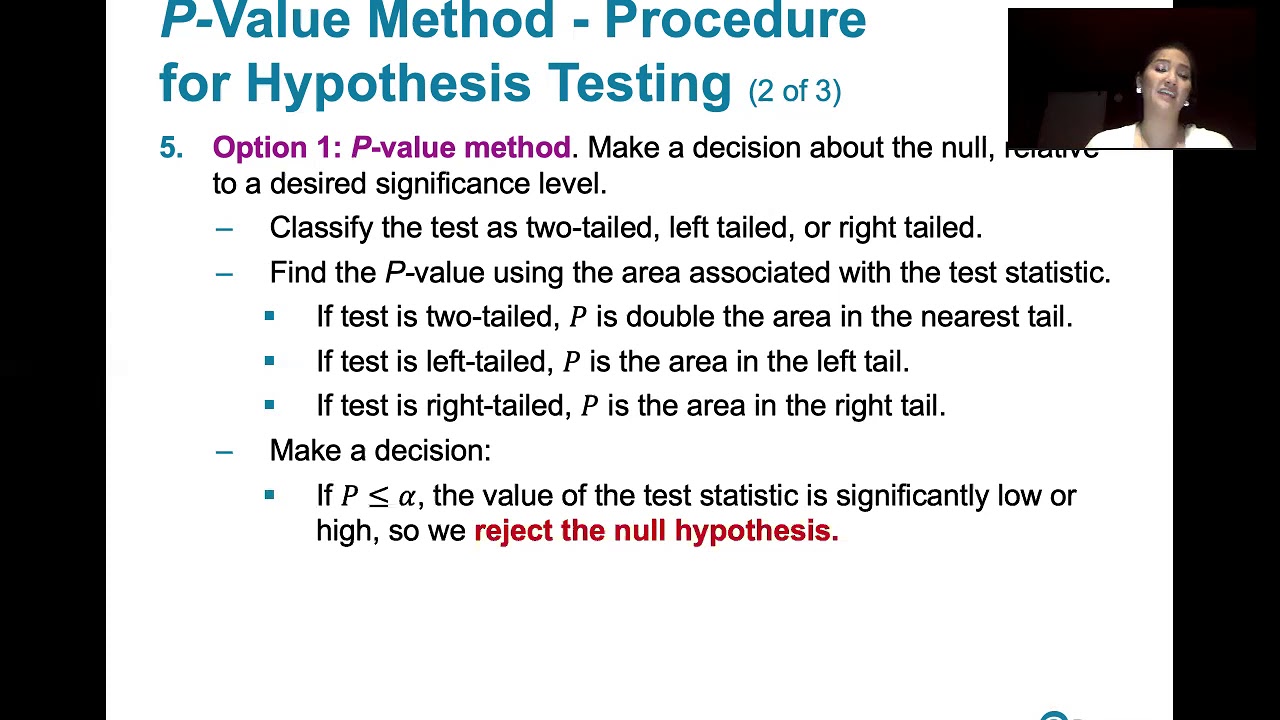
- 📊 The exact method is also a p-value method, but instead of estimating probabilities with a normal distribution, it uses the actual binomial probabilities to find p-values.
- 🔢 The video provides an example of testing the claim that the majority of Super Bowl winners are from the NFC, using the exact method and comparing it to the normal approximation method.
- 🤔 The script highlights the importance of interpreting the results of hypothesis testing correctly, stating that failing to reject the null hypothesis means there is not enough evidence to support the alternative claim, not that the null hypothesis is proven true.
- 📝 The conclusion of the example shows that there is not enough evidence to support the claim that the majority of Super Bowl winners are NFC teams, using both the exact method and the normal approximation method.
- 🔄 The video script concludes by emphasizing the consistency between the exact method and the normal approximation method, showing that both lead to the same conclusion despite providing slightly different probabilities.
Q & A
What is the binomial distribution method, also known as the exact method, used for in statistical testing?
-The binomial distribution method, or the exact method, is used for testing a claim about a proportion without relying on a normal approximation to the binomial distribution. It provides an exact probability calculation for the number of successes in a fixed number of trials.
What are the three methods studied in part one of the video that involve a normal approximation to the binomial distribution?
-The three methods studied in part one are the p-value method, the critical value method, and the confidence interval method. All of these methods use a normal approximation to estimate probabilities related to the binomial distribution.
Why might one choose to use the binomial distribution method over the normal approximation methods?
-One might choose the binomial distribution method over the normal approximation methods to avoid the use of an approximation and to obtain more precise results, especially when the sample size is small or when the conditions for a normal approximation are not well met.
What are the conditions required for using the binomial distribution method?
-The conditions required for using the binomial distribution method include having a simple random sample, a fixed number of trials, exactly two outcomes per trial (success and failure), independence of trials, and a constant probability of success across all trials.
How is the exact method different from the p-value method that uses a normal approximation?
-The exact method calculates p-values using the actual binomial probabilities, whereas the p-value method using a normal approximation estimates these probabilities based on the areas in the tails of the normal distribution beyond the test statistic.
What is the purpose of verifying the requirements before conducting a hypothesis test using the exact method?
-Verifying the requirements ensures that the conditions necessary for the validity of the binomial distribution method are met, such as the sample being a simple random sample and the trials being independent with a constant probability of success.
How does one identify the null and alternative hypotheses in the context of the exact method?
-The null hypothesis is identified by assuming the claimed proportion in the population is equal to a specific value (p), while the alternative hypothesis is formulated based on the claim being tested, such as p being greater than, less than, or not equal to the value assumed in the null hypothesis.
What is the process of calculating p-values using the binomial distribution in the exact method?
-The process involves computing the probabilities of getting the observed number of successes (x) or more extreme outcomes in the given number of trials (n), based on the assumed probability of success in the null hypothesis. This is done for left-tailed, right-tailed, or two-tailed tests, depending on the alternative hypothesis.
How does the decision to reject or fail to reject the null hypothesis in the exact method differ from other hypothesis testing methods?
-The decision process in the exact method is the same as in other hypothesis testing methods; if the calculated p-value is less than or equal to the significance level (alpha), the null hypothesis is rejected. If the p-value is greater than alpha, the null hypothesis is not rejected, indicating insufficient evidence against the null hypothesis.
What is the significance of stating the conclusion of a hypothesis test in non-technical terms?
-Stating the conclusion in non-technical terms ensures that the results of the hypothesis test are understandable to a broader audience, including those without a statistical background, making the findings more accessible and transparent.
Outlines
📚 Introduction to the Binomial Distribution Method
This paragraph introduces the binomial distribution method, also known as the exact method, for testing claims about a proportion without relying on approximations. It contrasts this method with the p-value, critical value, and confidence interval methods previously discussed, which all use a normal approximation to the binomial distribution. The speaker emphasizes the importance of reviewing concepts from Lesson 5.2 and the practicality of using technology to compute binomial probabilities, which would be tedious to do by hand. The paragraph also outlines the steps for the exact method, starting with verifying the requirements for a binomial distribution and identifying the null and alternative hypotheses.
🔍 Calculating P-Values Using Binomial Probabilities
The speaker explains how to calculate p-values using binomial probabilities for left-tailed, right-tailed, and two-tailed tests. They mention that there is no consensus on how to conduct a two-tailed test using binomial probabilities and that the method described is a choice made by the textbook author. The paragraph also covers the process of comparing the calculated p-value to the alpha level to make a decision about the null hypothesis. Additionally, the speaker discusses the importance of stating the conclusion in non-technical terms and how to handle situations where the number of successes is not directly given but is derived from a sample proportion.
🏈 Applying the Exact Method to a Super Bowl Example
The speaker provides a detailed example of applying the exact method to test the claim that the probability of an NFC team winning the Super Bowl is greater than one-half. They walk through the process of verifying the requirements for the binomial distribution, stating the null and alternative hypotheses, and identifying the necessary values for n (number of trials), x (number of successes), and p (probability of success in one trial). The paragraph includes instructions on how to use Excel to calculate binomial probabilities and how to sum these probabilities to find the p-value for the right-tailed test.
📊 Comparing P-Values from Exact and Normal Approximation Methods
In this paragraph, the speaker compares the p-value obtained using the exact method with the p-value from the normal approximation method. They explain how to calculate the test statistic and p-value using the normal approximation and highlight the consistency between the two methods, despite the difference in probabilities obtained. The speaker emphasizes the importance of understanding the underlying concepts to ensure that technology is not a 'black box' but a tool that aids in the computation process.
📉 Conclusion and Comparison of Hypothesis Testing Methods
The speaker concludes by summarizing the results of the hypothesis test, stating that there is not sufficient evidence to support the claim that the majority of Super Bowl winners are NFC teams. They explain the difference between failing to reject the null hypothesis and proving it to be true. The paragraph also discusses the conditions under which the normal approximation is appropriate and how it was applied in the example, showing that the normal approximation can yield slightly different probabilities but the same conclusion as the exact method.
Mindmap
Keywords
💡Binomial Distribution Method
💡Normal Approximation
💡P-Value Method
💡Critical Value Method
💡Confidence Interval Method
💡Factorials
💡Permutations and Combinations
💡Excel
💡Hypothesis Testing
💡Significance Level (Alpha)
💡P-Hat (p̂)
Highlights
Introduction to the binomial distribution method, also known as the exact method for testing a claim about a proportion.
Comparison with previously studied p-value method, critical value method, and confidence interval method which involve a normal approximation to the binomial distribution.
Explanation of the binomial distribution in detail, including the probability of x successes in n trials, involving permutations, combinations, and the addition and multiplication rules.
The impracticality of computing binomial probabilities by hand without technology due to the time-consuming nature of the calculations.
Demonstration of using Excel to compute binomial probabilities efficiently through built-in functions.
Clarification that the exact method is also a p-value method but uses binomial probabilities for exact calculations instead of normal approximation.
Outline of the method's steps, starting with verifying the requirements for a simple random sample and binomial distribution characteristics.
Identification of the null and alternative hypotheses as a necessary step in any hypothesis test.
Process of identifying the sample size (n), number of successes (x), and the claimed value of the proportion (p) in the null hypothesis.
Description of calculating p-values using binomial probabilities for left-tailed, right-tailed, and two-tailed tests.
Discussion on the lack of consensus on conducting two-tailed tests using binomial probabilities and the approach chosen by the textbook author.
Comparison of p-values to alpha to make a decision about the null hypothesis, with a focus on the interpretation of the results.
Explanation of how to state the conclusion in non-technical terms for better understanding by a general audience.
Example of calculating the number of successes (x) from a given sample proportion (p-hat) when exact numbers are not provided.
Application of the exact method to a hypothesis test using a USA Today survey example about replacing passwords with biometric security.
Comparison of the exact method's p-value to the p-value obtained using the normal approximation to the binomial distribution in a Super Bowl example.
Consistency between the exact method and the normal approximation method in reaching the same conclusion for the hypothesis test.
Final conclusion about the claim regarding the majority of Super Bowl winners being NFC teams, stating there is not sufficient evidence to support the claim.
Transcripts
Browse More Related Video
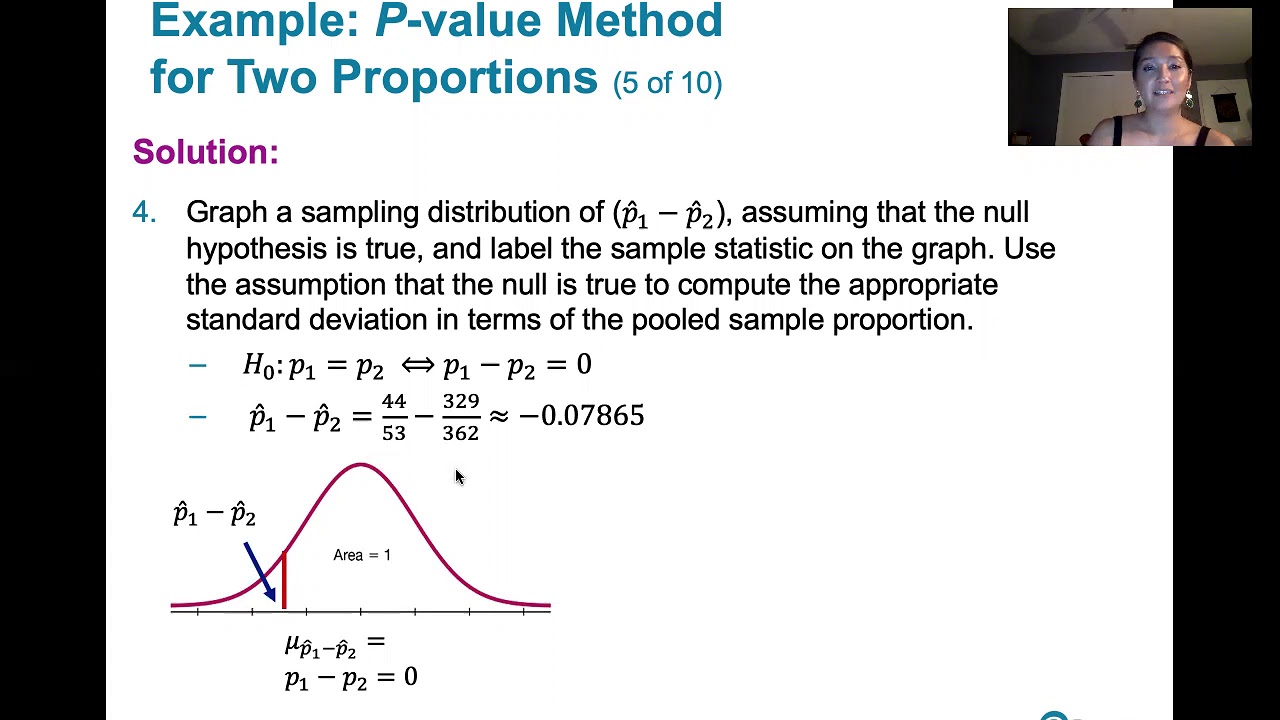
9.1.2 Two Proportions - Example, P-Value Method, Normal Approximation to the Binomial Distribution
8.2.1 Testing a Claim About a Proportion - P-value, Critical Value Methods, Normal Approximation
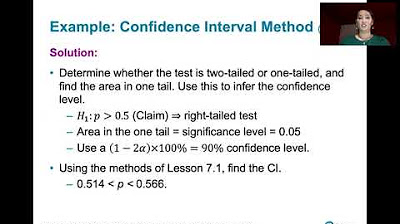
8.2.2 Testing a Claim About A Proportion - Confidence Interval Method, Comparison to Other Methods
8.2.0 Testing a Claim About a Proportion - Lesson Overview, Learning Outcomes, Key Concepts
9.1.1 Two Proportions - Rationale Behind Hypothesis Tests Involving Two Proportions
10.1.5 Correlation - Testing a Claim of Correlation Using the P-Value Method
5.0 / 5 (0 votes)
Thanks for rating: