Y1/IB 29) Subsidy and Deadweight Welfare Loss
TLDRThis video script delves into the concept of deadweight loss caused by government subsidies. It explains how subsidies distort market efficiency, leading to a reduction in total surplus and the emergence of a deadweight loss represented by an unaccounted area. The script guides viewers through the impact of subsidies on consumer and producer surplus, government costs, and the overall welfare loss to society, using diagrams to illustrate the changes in market outcomes before and after subsidy implementation.
Takeaways
- 🔍 Subsidies can cause a deadweight loss in the market.
- 💡 Government intervention in the market distorts the efficient allocation of resources.
- 📉 Deadweight loss represents a loss to society due to market inefficiencies caused by subsidies.
- 🔄 Before the subsidy, the total surplus in the market was a combination of consumer and producer surplus.
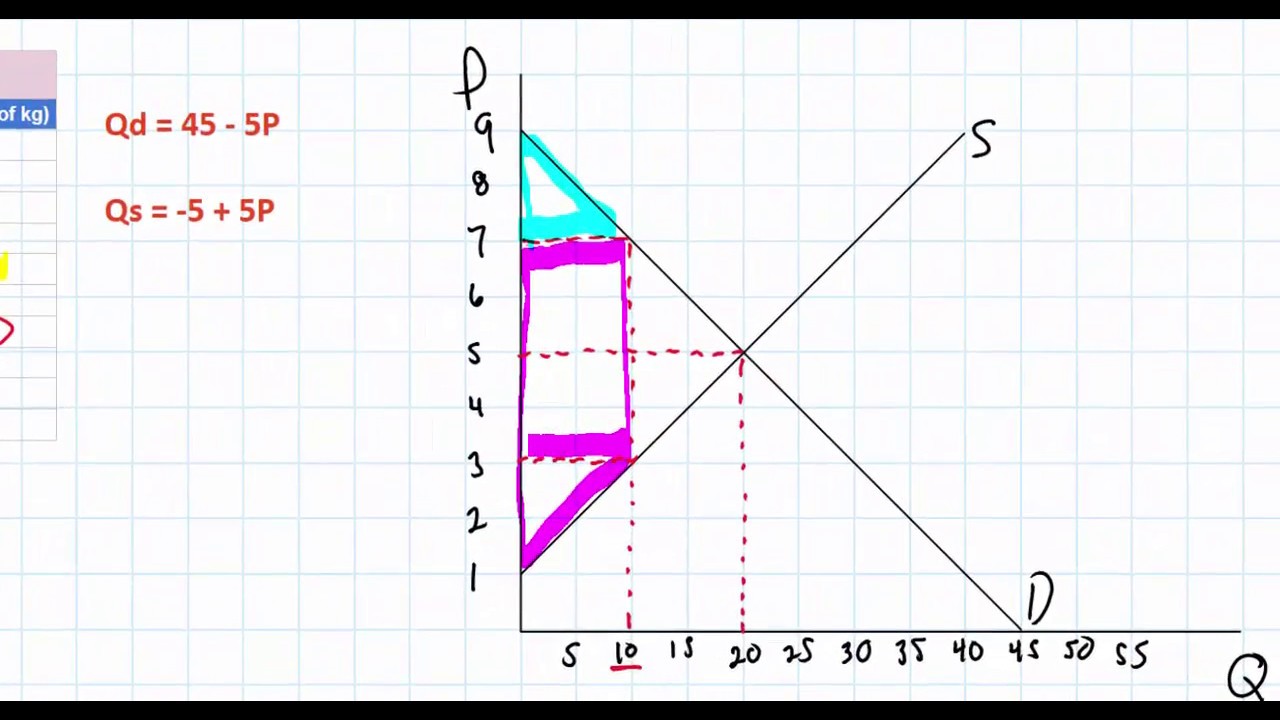
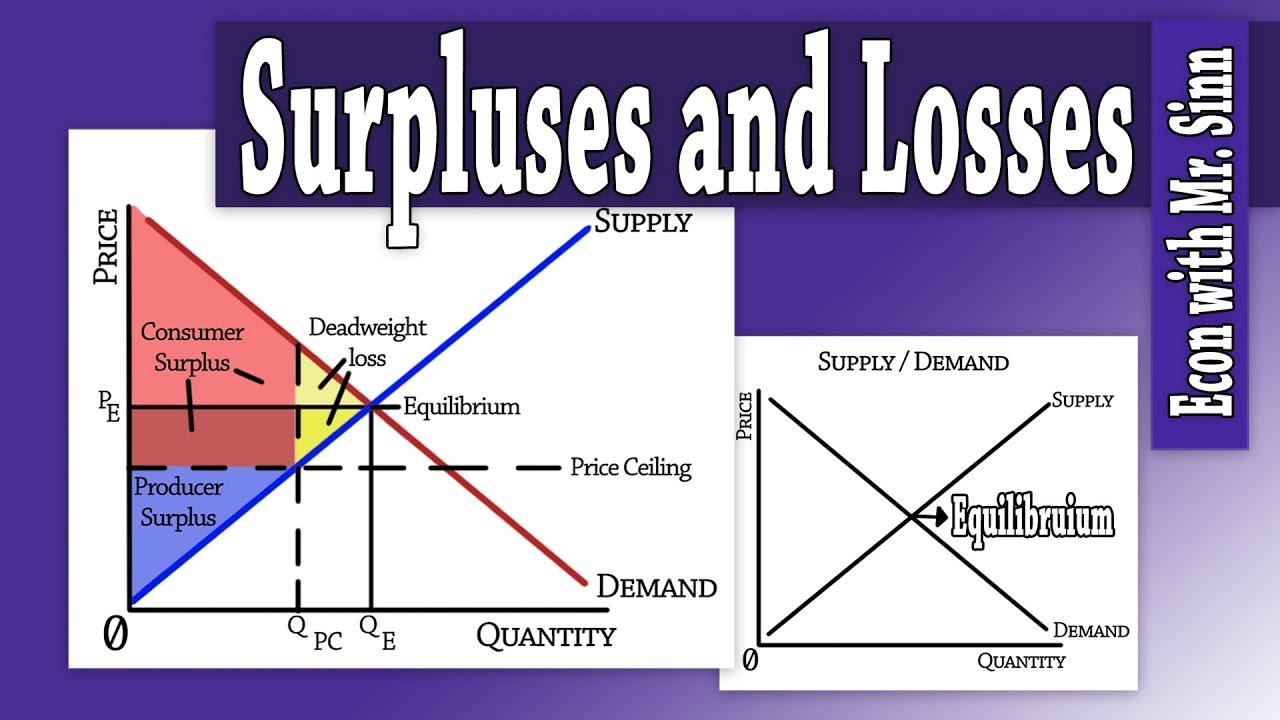
- 🧮 Consumer surplus is the area beneath the demand curve and above the price.
- 🛠️ Producer surplus is the area above the supply curve and beneath the price.
- 💸 When a subsidy is implemented, the government incurs a cost equal to the subsidy amount multiplied by the quantity.
- 📊 The new consumer surplus increases due to the lower price, and the new producer surplus increases due to the subsidy.
- 🔻 The total surplus after the subsidy is the original total surplus minus the deadweight loss.
- 📉 The deadweight loss is represented by the unaccounted area 'H', indicating a societal cost.
Q & A
What is a subsidy and why does it cause a deadweight loss?
-A subsidy is a financial aid provided by the government to individuals or industries to support production or consumption. It causes a deadweight loss because it distorts the efficient allocation of resources set by the market, leading to a reduction in total surplus in society.
How is consumer surplus calculated in the free market?
-Consumer surplus is calculated as the area beneath the demand curve and above the market price. In the script, it is represented by the area A + B.
What is the initial producer surplus in the free market scenario described in the script?
-The initial producer surplus is the area above the supply curve and beneath the market price, which in the script is denoted as the area C + D.
What was the total surplus in the market before the subsidy was implemented?
-The total surplus before the subsidy was the sum of consumer surplus, producer surplus, and the area representing the absence of government intervention, which is A + B + C + D.
How does the implementation of a subsidy affect the price and quantity in the market?
-The implementation of a subsidy typically lowers the price for consumers (P2 in the script) and increases the quantity supplied, as producers are incentivized to produce more due to the financial aid they receive from the government.
What is the new consumer surplus after the subsidy is implemented?
-After the subsidy, the new consumer surplus is the area below the demand curve but above the new price, which is A + B + C + F + G in the script.
How is the new producer surplus calculated with the subsidy in place?
-The new producer surplus is the area above the supply curve and beneath the price producers receive, which includes the subsidy. It is B + C + D + E in the script.
What is the cost to the government for implementing the subsidy?
-The cost to the government is the rectangle B C F G in the script, representing the total amount of money paid out as subsidies.
What is the total surplus after the subsidy is implemented, and how does it compare to the initial total surplus?
-The new total surplus after the subsidy is A + B + C + D minus H. Comparing it to the initial total surplus, there is a loss of area H, which represents the deadweight loss to society.
What is the significance of the unaccounted area H in the script?
-The unaccounted area H represents the deadweight loss to society as a result of the government's intervention through the subsidy. It signifies the inefficiency and extra cost incurred that was not present in the free market.
Why is it important for economists to understand the concept of deadweight loss?
-Understanding deadweight loss is crucial for economists to evaluate the efficiency of market interventions and to make informed policy decisions that minimize societal costs and maximize welfare.
Outlines
📉 Impact of Subsidies on Market Efficiency and Deadweight Loss
This paragraph delves into the concept of deadweight loss resulting from government subsidies. It explains how market interventions, such as subsidies, distort the efficient allocation of resources and lead to a loss in total surplus. The speaker uses the example of a subsidy to illustrate how consumer and producer surpluses change, and how the government incurs costs. The paragraph concludes by highlighting the area of deadweight loss, represented by a triangle, which signifies the inefficiency and societal cost introduced by the subsidy.
💼 Societal Cost of Subsidies and the Concept of Deadweight Loss
The second paragraph continues the discussion on subsidies, focusing on the societal cost and the纳税人(taxpayers)burden. It emphasizes that the implementation of a subsidy leads to an extra cost borne by taxpayers, which was not present before the subsidy. The paragraph reinforces the idea that the deadweight loss, symbolized by the unaccounted area 'H', is a direct consequence of government intervention in the market. The summary concludes by encouraging viewers to understand the broader implications of subsidies on economic welfare and societal costs.
Mindmap
Keywords
💡Warrior
💡Subsidy
💡Deadweight Loss
💡Market Intervention
💡Efficient Allocation of Resources
💡Consumer Surplus
💡Producer Surplus
💡Equilibrium
💡Welfare Economics
💡Supply and Demand Curves
💡Government Cost
Highlights
The video discusses the concept of deadweight loss caused by subsidies.
Government intervention in the market through subsidies can lead to an inefficient allocation of resources.
Deadweight loss is represented by the area of a triangle in subsidy diagrams.
Consumer and producer surpluses are isolated to understand the impact of subsidies on the market.
The initial market equilibrium is established with supply (S1) equaling demand (D1).
Consumer surplus is calculated as the area beneath the demand curve and above the initial price.
Producer surplus is the area above the supply curve and beneath the initial price.
The absence of a subsidy in the free market means no government cost or revenue.
Total surplus without a subsidy is the sum of consumer and producer surpluses.
The implementation of a subsidy changes the market equilibrium and consumer and producer prices.
Consumers benefit from lower prices due to subsidies, increasing consumer surplus.
Producers gain additional revenue from the government subsidy on top of consumer payments.
The government incurs a cost equal to the rectangle formed by the subsidy's impact on the market.
The total surplus after the subsidy is calculated by adding consumer, producer surpluses, and subtracting the government cost.
The comparison between the old and new total surplus reveals a loss represented by the unaccounted area H.
The deadweight loss (area H) is the cost society bears due to government intervention in the market.
Taxpayers fund the subsidy, which was not a cost in the initial free market scenario.
The video concludes by emphasizing the importance of understanding the impacts of subsidies on market outcomes and societal welfare.
Transcripts
Browse More Related Video


5.0 / 5 (0 votes)
Thanks for rating: