The standard error, Clearly Explained!!!
TLDRIn this StatQuest episode, the focus is on standard errors and their significance in data analysis. The video explains the concept of error bars, particularly standard deviations and standard errors, using a scatter plot with sample data. It delves into the standard error of the mean, illustrating how it's calculated and its importance in understanding the variability of sample means. The episode also introduces bootstrapping as a method to estimate standard errors when a direct formula isn't available, demonstrating its simplicity and effectiveness through a step-by-step example.
Takeaways
- 📊 Error bars are closely related to standard errors and are used to represent the variability in data, with three common types: standard deviations, standard errors, and confidence intervals.
- 📈 Standard deviations are familiar to most and indicate how data points are distributed around the mean, with larger values indicating greater dispersion.
- 📉 Standard errors provide insight into the distribution of the means of multiple samples rather than the individual data points themselves.
- 🧬 In a normal distribution, most samples will be close to the average, and the means of these samples will also be relatively close to each other, forming the basis for calculating standard errors.
- 🔢 The standard error of the mean (SEM) is calculated by taking the standard deviation of the means from multiple samples, which is typically smaller than the standard deviation of the raw data.
- 📚 The SEM gives an idea of how much variation we can expect in the means if we take multiple independent samples from the same population.
- 🔄 Bootstrapping is a method used to estimate standard errors when a simple formula is not available, involving resampling the original data multiple times to generate new means.
- 🔢 The formula for estimating the standard error of the mean without bootstrapping is the population standard deviation divided by the square root of the sample size.
- 🔄 Bootstrapping involves random resampling from the original data set, calculating the statistic of interest (e.g., mean) for each resample, and then determining the standard deviation of these statistics.
- 📋 Dynamite plots are a presentation style where the mean and standard deviation are displayed instead of the original data, with each column resembling the igniter of a stick of dynamite.
- 🔎 Confidence intervals, related to standard errors, will be explained in a future Stat Quest episode, indicating the range within which the true population parameter is likely to fall.
Q & A
What is the main topic discussed in the Stat Quest video?
-The main topic discussed in the video is standard errors, including their calculation and the concept of error bars in data representation.
What is the relationship between error bars and standard errors?
-Error bars on a graph often represent standard errors, which indicate the amount of variability or dispersion of the sample means from the population mean.
Why are error bars useful in data visualization?
-Error bars are useful because they provide a visual representation of the uncertainty or variability in the data, helping to convey the spread of the data points around the mean.
What are the three common types of error bars mentioned in the video?
-The three common types of error bars are standard deviations, standard errors, and confidence intervals.
What is a 'dynamite plot' and why is it called so?
-A dynamite plot is a graphical representation where the mean and standard deviation are displayed for each group. It is called so because each column resembles the igniter of a stick of dynamite.
How is the standard deviation related to the standard error of the mean?
-The standard deviation of the mean, or standard error, is the standard deviation of the distribution of sample means, and it is generally smaller than the standard deviation of the individual data points.
What is the rule of thumb for the proportion of data covered by standard deviations from the mean?
-The rule of thumb is that one standard deviation on each side of the mean covers about 68% of the data, and two standard deviations cover about 95% of the data.
Why might the standard error be smaller than the standard deviation of the individual samples?
-The standard error is smaller because it measures the variability of the means of multiple samples, which tend to be closer to each other than the individual data points are to the overall mean.
What is bootstrapping and how is it used to calculate standard errors?
-Bootstrapping is a resampling technique where random samples are drawn with replacement from the original data set, and statistics such as the mean are calculated for each resample. The standard error is then calculated from these bootstrapped means.
Can bootstrapping be used to estimate standard errors for any statistic?
-Yes, bootstrapping can be used to estimate the standard error of any statistic by resampling the data and calculating the standard deviation of the calculated statistics across all resamples.
What is the formula for estimating the standard error of the mean without using bootstrapping?
-The formula for estimating the standard error of the mean is the standard deviation of the population divided by the square root of the sample size (SD/√n).
Outlines
📊 Understanding Standard Errors and Error Bars
This paragraph introduces the concept of standard errors and error bars in the context of data analysis. It explains how error bars, which represent the standard deviation of data, can be plotted on a graph to show the distribution of data points around the mean. The paragraph also discusses the use of dynamite plots, which display the mean and standard deviation, and the three types of error bars: standard deviations, standard errors, and confidence intervals. The standard error of the mean is emphasized as a measure of how the means of multiple samples vary, and the concept of a normal distribution is used to illustrate the calculation of standard deviations and means from a sample.
🔍 Calculating and Interpreting Standard Error
The second paragraph delves deeper into the calculation of the standard error of the mean, highlighting its importance in understanding the variability of sample means. It explains the process of calculating the standard error by taking multiple samples, calculating their means, and then determining the standard deviation of these means. The paragraph clarifies that the standard error is generally smaller than the standard deviation of individual samples because the means are less dispersed. It also touches on other types of standard errors, such as the standard error of standard deviations, and introduces the concept of bootstrapping as a method to estimate standard errors when a direct formula is not available.
🚀 Bootstrapping: A Practical Approach to Estimating Standard Errors
The final paragraph focuses on bootstrapping as a practical technique for estimating standard errors when a simple formula is not applicable. It outlines the steps involved in bootstrapping, which include randomly selecting measurements from a sample, calculating the desired statistic (such as the mean), and repeating this process multiple times to generate a distribution of statistics. The standard error is then calculated as the standard deviation of these bootstrapped statistics. The paragraph emphasizes the simplicity and effectiveness of bootstrapping as a method to understand the variability of sample means and other statistics.
Mindmap
Keywords
💡Standard Error
💡Error Bars
💡Bootstrapping
💡Scatter Plot
💡Mean
💡Standard Deviation
💡Dynamite Plot
💡Confidence Intervals
💡Normal Distribution
💡Sample
💡Population
Highlights
Introduction to standard errors and their relation to error bars.
Explanation of error bars in the context of a scatter plot with sample data.
Illustration of calculating means and standard deviations for data sets.
The concept of a dynamite plot for representing mean and standard deviation.
Description of three common types of error bars: standard deviations, standard errors, and confidence intervals.
Visual representation of a normal distribution and its relation to the weight of mice.
The process of sampling from a population and calculating the mean and standard deviation from the sample.
Rule of thumb for the proportion of data covered by standard deviations from the mean.
Demonstration of overlaying multiple sample means and standard deviations on a graph.
The concept of standard error of the mean and its calculation from multiple sample means.
Difference between standard deviation of individual samples and the standard error of the mean.
Introduction to the standard error of standard deviations and its significance.
General method for calculating standard errors of any statistic from multiple samples.
Formula for estimating the standard error of the mean without multiple samples.
Introduction to bootstrapping as a method for estimating standard errors without a formula.
Step-by-step process of bootstrapping to generate a standard error of the mean.
Comparison of calculated standard error using bootstrapping to the theoretical formula.
Conclusion on the importance of standard error in understanding sample variability and its calculation methods.
Transcripts
Browse More Related Video
Standard Error (of the sample mean) | Sampling | Confidence Intervals | Proportions
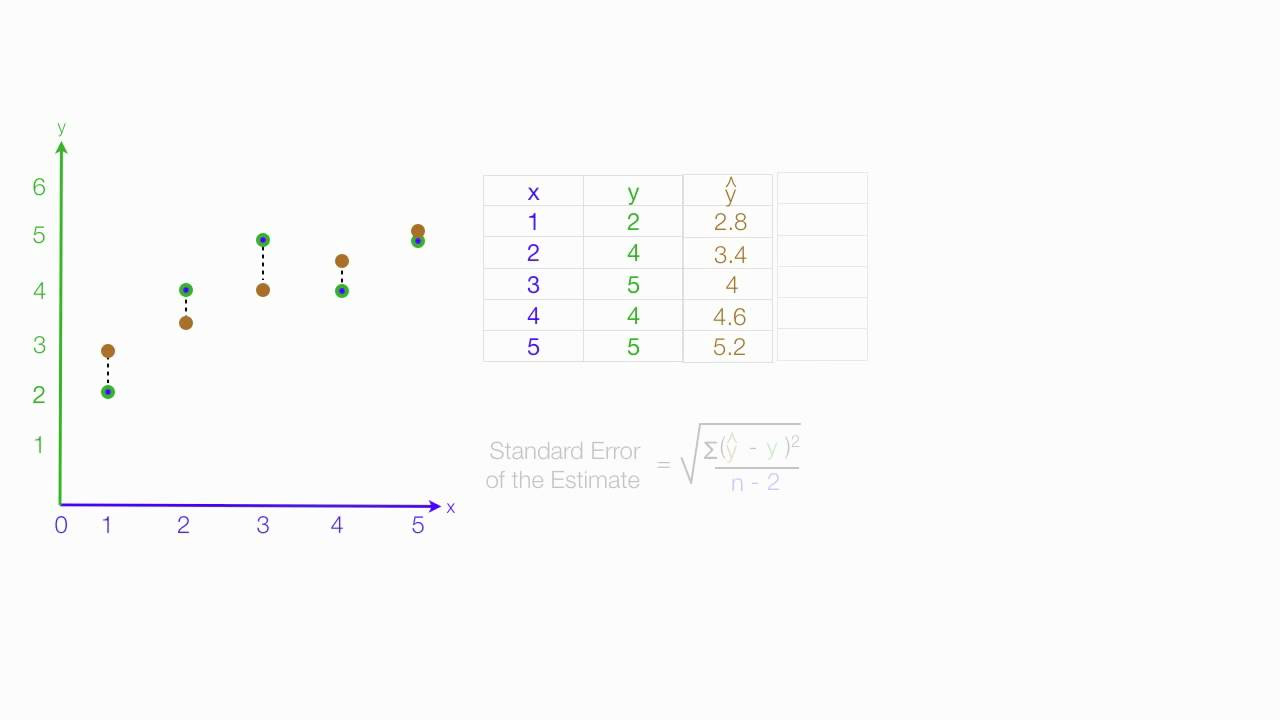
Standard Error of the Estimate used in Regression Analysis (Mean Square Error)
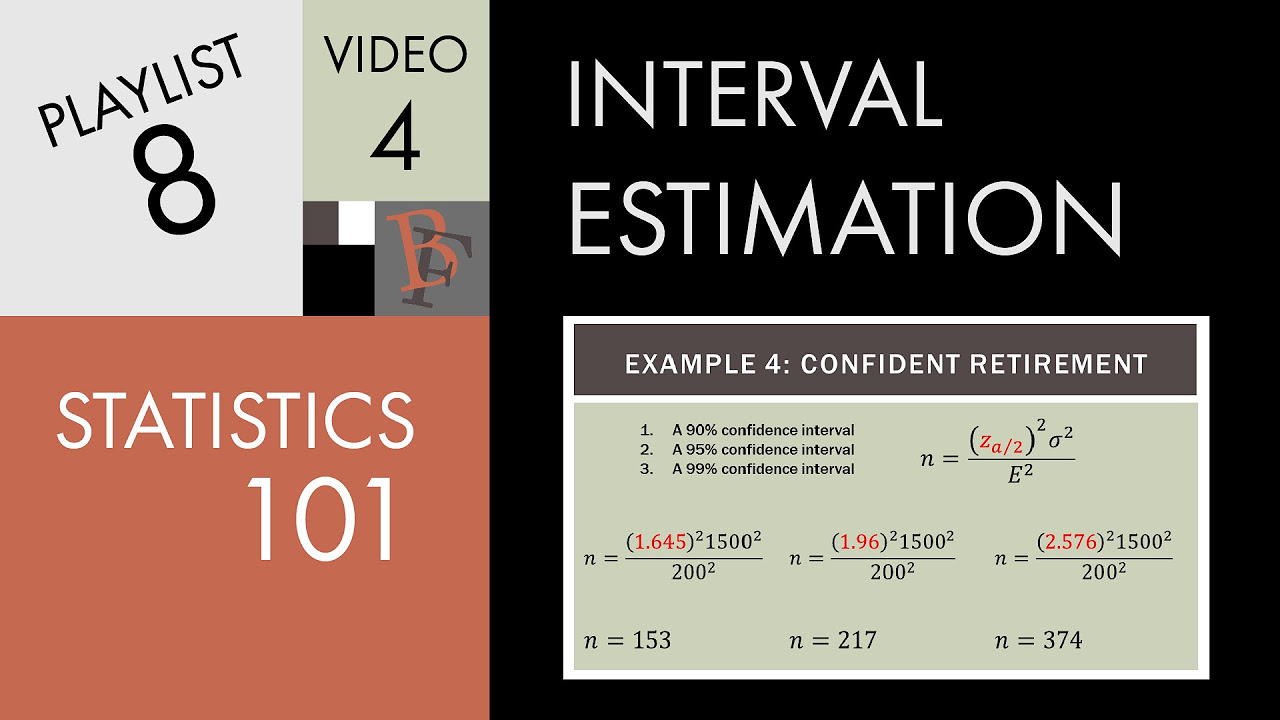
Statistics 101: Confidence Intervals, Estimating Sample Size Needed
Standard Error of the Mean: Concept and Formula | Statistics Tutorial #6 | MarinStatsLectures
Standard Deviation & Degrees of Freedom Explained | Statistics Tutorial | MarinStatsLectures
Statistics Lecture 3.3: Finding the Standard Deviation of a Data Set
5.0 / 5 (0 votes)
Thanks for rating: