Descriptive Statistics: The median
TLDRIn this video, the host, Justin is Elsa, explains the concept of the median in descriptive statistics, a measure of central tendency that represents the middle value of a dataset when ordered. The video provides an intuitive approach to understanding the median, including how to calculate it for both odd and even numbers of observations. It contrasts the median with the mean, highlighting situations where the median is more robust, particularly in skewed distributions like property prices. The host also poses a challenge question, inviting viewers to discuss scenarios where the median would be preferred over the mean.
Takeaways
- 📚 The median is defined as the middle number in a series when ordered from lowest to highest.
- 📝 The term 'median' comes from the Latin 'medius annus', meaning 'middle of the year'.
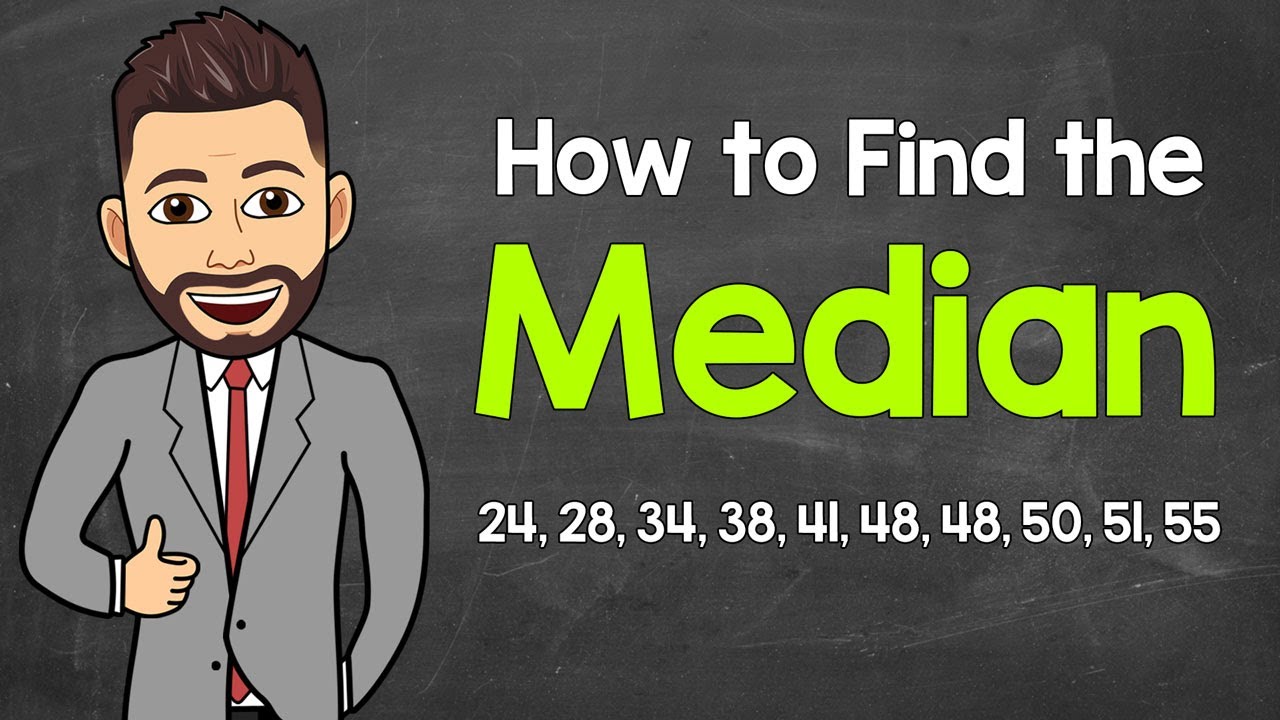
- 🔢 To find the median, a data set must be ordered, and the middle number is identified; for an odd number of observations, the median is the middle number, and for an even number, it is the average of the two middle numbers.
- 🌐 The presenter, Justin is Elsa, aims to keep the explanation intuitive while covering all bases and adding advanced topics for experienced viewers.
- 📉 The median and the mean are both measures of central tendency, indicating where the data is centered.
- 📊 In symmetric distributions, such as uniform or bell-shaped curves, the mean and median are roughly equal.
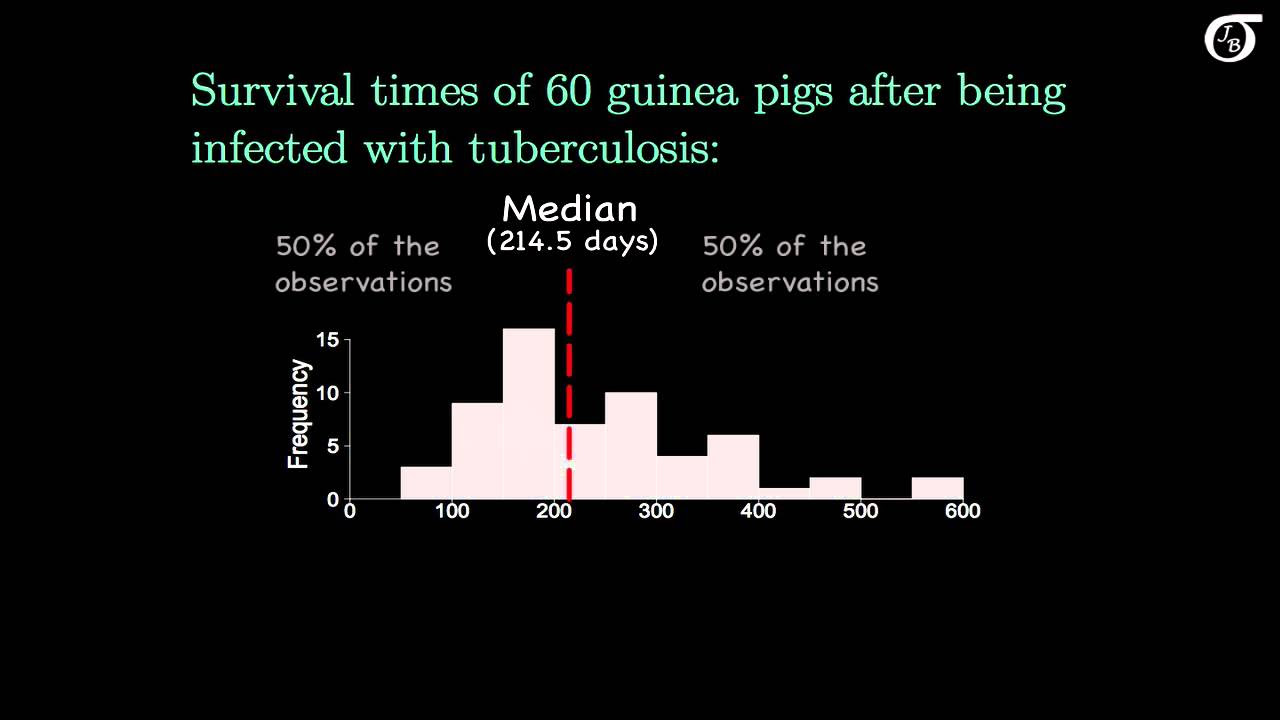
- 📈 However, in skewed distributions, especially those with a long tail on the right, the mean is usually higher than the median due to the influence of extreme values.
- 🏠 The median is often preferred in scenarios with skewed data, such as property prices, where it provides a more representative measure of central tendency.
- 🤔 The video poses a challenge question asking viewers to consider other scenarios where the median might be preferred over the mean.
- 📈 The video demonstrates the difference between mean and median through an example dataset, showing how the mean can be affected by outliers.
- 📚 The presenter emphasizes the importance of ordering the data before finding the median and criticizes the complexity of the formulas provided for calculating the median.
Q & A
What is the origin of the word 'median'?
-The word 'median' comes from the Latin 'media aetas', which means the middle of one's life.
What is the official definition of the median in statistics?
-The median is the middle number of a series when the numbers are ordered from lowest to highest.
How is the median represented in statistical notation?
-The median can be represented using the word 'median', the symbol 'med', or 'X̄' with a tilde (~) on top; there is no universal consensus on the notation.
What is the difference between the median and the mean?
-The median is the middle value in a data set when ordered, whereas the mean is the average of all values in the data set, calculated by summing all values and dividing by the number of observations.
How do you find the median of a data set with an even number of observations?
-For an even number of observations, you find the two middle numbers, calculate their average, and that is the median of the data set.
What is the significance of the mean being different from the median?
-A difference between the mean and the median can indicate the presence of skewness in the data distribution, with the median often being more robust to extreme values.
What is a symmetric distribution and how does it relate to the mean and median?
-A symmetric distribution is one where the data is evenly spread around the center, such as a uniform or bell curve distribution. In such cases, the mean and median are roughly equal.
What type of data distribution would cause the mean to be higher than the median?
-A skewed distribution with a long tail on the right side, such as in property prices, can cause the mean to be higher than the median due to the influence of extreme high values.
Why might the median be preferred over the mean in certain scenarios?
-The median is often preferred when the data set is skewed, as it is less affected by extreme values and provides a better representation of the central tendency for the majority of the data.
What is the challenge question posed by the video creator regarding the median?
-The challenge question asks in what other scenarios, besides house prices, the median might be preferred over the mean.
Where can viewers find more videos on statistics by the same creator?
-More videos on statistics by the creator can be found at zeddstatistics.com.
Outlines
📊 Introduction to Descriptive Statistics: Median
The video begins with an introduction to descriptive statistics, focusing on the concept of the median. The host, Justin or Elsa, aims to keep the explanation intuitive yet comprehensive, with an added advanced topic to engage experienced viewers. The median is defined as the middle number in an ordered series, illustrated with the example series 10, 28, 28, 33, and 54, where the median is 28. The video also discusses the difference between the median and the mean, using the series as an example to show that the median can differ from the mean, which in this case is 30.6. The host also poses a challenge question for viewers to consider when the median might be more useful than the mean.
🔍 Understanding Median Calculation and Its Comparison with Mean
This paragraph delves deeper into how to calculate the median, especially when dealing with an even number of observations. The example series is expanded to include the number 59, making the dataset 10, 28, 28, 33, 54, and 59. The median is now calculated as the mean of the two middle numbers, 28 and 33, resulting in 30.5. The video contrasts this with the mean, which is affected by extreme values and can be pulled towards them, as demonstrated by replacing 54 with 540 in the dataset. This change significantly increases the mean to 127.8, while the median remains unaffected at 28, highlighting the robustness of the median in the presence of outliers. The host suggests that the median might be a more appropriate measure of central tendency in such scenarios and invites viewers to discuss other situations where the median is preferred over the mean in the comments section.
Mindmap
Keywords
💡Median
💡Descriptive Statistics
💡Mean
💡Central Tendency
💡Skewed Distribution
💡Mode
💡Symmetric Distribution
💡Bimodal Distribution
💡Robustness
💡Property Prices
💡Challenge Question
Highlights
The video discusses the concept of the median in descriptive statistics.
Median is defined as the middle number of an ordered series.
The video aims to keep the explanation intuitive while being comprehensive.
The presenter introduces an advanced topic on when the median might be more useful than the mean.
The video includes a challenge question for viewers to discuss in the comments.
The median is calculated by finding the middle number in an ordered set.
Different notations for median are mentioned, such as 'med' or 'X with a tilde'.
The mean and median are measures of central tendency, indicating where the data is centered.
The video explains how to find the median when there is an even number of observations.
The presenter critiques the complexity of median formulas and prefers an intuitive approach.
The video explores scenarios where the mean and median differ, especially in skewed distributions.
In symmetric distributions, the mean and median are roughly equal.
Skewed distributions with a long tail can cause the mean to be higher than the median.
The median is more robust and less affected by extreme values compared to the mean.
The video provides an example of how replacing a value affects the mean and median differently.
The median is often preferred in scenarios with skewed data, such as property prices.
The presenter invites viewers to share scenarios where the median is preferred over the mean.
The video concludes with a reminder of the website for more videos on statistics.
Transcripts
Browse More Related Video

5.0 / 5 (0 votes)
Thanks for rating: