How to setup on screen stats in games with MSI Afterburner and RivaTuner.
TLDRThis tutorial video offers a step-by-step guide on setting up a metrics overlay for benchmarking systems, enabling users to monitor system stats like average FPS. The video recommends using MSI Afterburner in conjunction with RivaTuner Statistics Server for a consistent and comprehensive overlay across different graphics card brands. It demonstrates the installation process, configuration of the overlay to display desired metrics, and customization of the on-screen display's appearance. The guide ensures that viewers can set up their own overlay without closing the applications, providing a clear and functional overlay for benchmarking.
Takeaways
- 🕹️ The video provides a guide on setting up a metrics overlay for benchmarking in gaming.
- 📊 The overlay is used to monitor system statistics such as average FPS during benchmarks.
- 💻 Built-in software from AMD, Nvidia, and Intel can be used for overlays, but the video recommends using MSI Afterburner with Reaper tube for consistency and additional features.
- 🔗 MSI Afterburner and Reaper tube not only show real-time FPS but also calculate the 1% and 0.1% lows across the benchmark.
- 🖥️ The demonstration is conducted on a small APU build system, with a link to the build video provided at the end.
- 📥 To set up the overlay, download and install MSI Afterburner from the official website, followed by the installation of Reaper tuner.
- 🛠️ MSI Afterburner is primarily used for overclocking and managing fan profiles, but in this guide, it's used for the metrics overlay.
- 🎮 Configure the overlay by opening a game in windowed mode, navigating to the monitoring tab in MSI Afterburner, and selecting the desired metrics.
- 📊 The video demonstrates setting up an on-screen display (OSD) for frame rate, frame time, and low percentages, grouping them under 'FPS'.
- 🔧 Additional system metrics like CPU name, temperature, usage, and clock can be added to the overlay for a comprehensive view.
- 📈 The frame time can be displayed as a graph for a visual representation of gameplay smoothness.
- 🛑 It's important to keep both MSI Afterburner and Reaper tuner running in the background to maintain the overlay during gameplay.
Q & A
What is the purpose of the metrics overlay in benchmarks?
-The purpose of the metrics overlay in benchmarks is to provide a real-time view of the system's performance statistics, such as average FPS, one percent low, and 0.1 percent low, which helps in evaluating the system's performance during the benchmark.
Which built-in software can be used for an overlay system with graphics cards?
-Built-in software from AMD, Nvidia, and Intel can be used for an overlay system with graphics cards.
Why is MSI Afterburner used in conjunction with Riva Tuner in the video?
-MSI Afterburner is used in conjunction with Riva Tuner for two reasons: to maintain a consistent look across different brands of graphics cards and to provide not only real-time FPS but also calculate the frametime across the benchmark, including one percent and 0.1 percent lows.
How can I download MSI Afterburner?
-To download MSI Afterburner, open your favorite browser, search for 'MSI Afterburner', visit the MSI landing page, and click on the 'download here' link.
What is the process of installing MSI Afterburner and Riva Tuner?
-After downloading MSI Afterburner, extract the ZIP file and run the setup. During installation, you will be prompted to install multiple components. Choose to install both MSI Afterburner and Riva Tuner, accept the license agreement, and proceed with the installation in the default folder.
What is the first step to configure the overlay in MSI Afterburner?
-The first step to configure the overlay is to open a game in windowed mode and navigate to the 'Monitoring' tab in MSI Afterburner to set up the desired components for the overlay.
Which components are typically set up for the metrics overlay in the video?
-The components typically set up for the metrics overlay include frame rate, frame time, average frame rate, one percent low, and 0.1 percent low.
How can you customize the on-screen display (OSD) for the game?
-To customize the OSD, select the desired components, check 'Show in on-screen display', and override the group name to a preferred label. Apply the settings, and the overlay will appear in the game.
What additional settings can be configured through Riva Tuner Stats?
-Through Riva Tuner Stats, you can configure the appearance of the overlay, such as removing the fill from behind the stats, moving the overlay to different corners, and adjusting the global settings that apply to all games.
Why is it important not to close MSI Afterburner and Riva Tuner after setting up the overlay?
-It is important not to close MSI Afterburner and Riva Tuner because closing these applications will cause the overlay to disappear. Instead, minimize them to keep the overlay running in the game.
Can the overlay display be customized to show different system specifications?
-Yes, the overlay display can be customized to show different system specifications such as CPU name, temperature, usage, clock speed, and GPU settings by selecting the appropriate components in MSI Afterburner and configuring them in Riva Tuner Stats.
Outlines
📊 Setting Up Metrics Overlay for Benchmarks
This paragraph provides a step-by-step guide on how to set up a metrics overlay for benchmarking purposes. The speaker explains that while most graphics card manufacturers offer built-in software for this, they prefer using MSI Afterburner in combination with RivaTuner Statistics Server for its consistency and additional features like calculating the average FPS and the 1% and 0.1% lows across the benchmark. The process involves downloading and installing MSI Afterburner from its official website, extracting the ZIP file, and following the installation prompts. The speaker also mentions that during installation, the user will be prompted to install RivaTuner Statistics Server, which is necessary for the overlay functionality. The paragraph concludes with the speaker preparing to demonstrate the setup using a game in windowed mode.
🛠️ Configuring MSI Afterburner and RivaTuner for Overlay
The speaker continues the tutorial by detailing how to configure MSI Afterburner and RivaTuner to display the metrics overlay during gameplay. They guide the viewer through the process of opening the MSI Afterburner application, navigating to the monitoring tab, and setting up the desired components such as frame rate, frame time, and low percentiles. The speaker emphasizes the importance of grouping these components and enabling the on-screen display (OSD) for each group. They also demonstrate how to customize the appearance of the overlay, such as changing the display type to a graph for frame time to provide a visual representation of gameplay smoothness. The paragraph concludes with additional tips on configuring the overlay's aesthetics through RivaTuner Statistics Server and a reminder to keep both applications running in the background to maintain the overlay during gameplay.
Mindmap
Keywords
💡Metrics Overlay
💡Benchmarks
💡FPS (Frames Per Second)
💡MSI Afterburner
💡Riva Tuner
💡APU (Accelerated Processing Unit)
💡Overclocking
💡On-Screen Display (OSD)
💡Frame Time
💡CPU Temperature
💡Customization
Highlights
Guide on setting up a metrics overlay for benchmarking in the corner of the screen.
Explanation of the importance of seeing system stats such as average FPS during benchmarks.
Mention of built-in software for AMD, Nvidia, and Intel graphics cards for overlay systems.
Introduction of MSI Afterburner and Reaper Tube as the chosen applications for the overlay.
Reasons for using MSI Afterburner and Reaper Tube: consistent look across brands and additional benchmark calculations.
Demonstration using a small APU build system.
Instructions on downloading MSI Afterburner from the official website.
Steps for installing MSI Afterburner and the additional components.
Installation process of Reaver Tuner Statistics Server.
How to open MSI Afterburner and its initial screen for overclocking and fan profiles.
Setting up the metrics overlay by opening a game and configuring the monitoring tab.
Configuration steps for enabling frame rate, frame time, and low percentage metrics on the overlay.
Instructions on grouping and naming the metrics for easy identification.
Adding CPU temperature, usage, and clock to the overlay for APU builds.
Customizing the appearance of the frame time graph for better readability.
How to configure the overlay's appearance using Riva Tuner Statistics Server.
Importance of keeping MSI Afterburner and Riva Tuner running to maintain the overlay.
Final words on the setup process and its utility for benchmarking.
Transcripts
Browse More Related Video
How to get On Screen Stats to show on games! EASY and FREE!
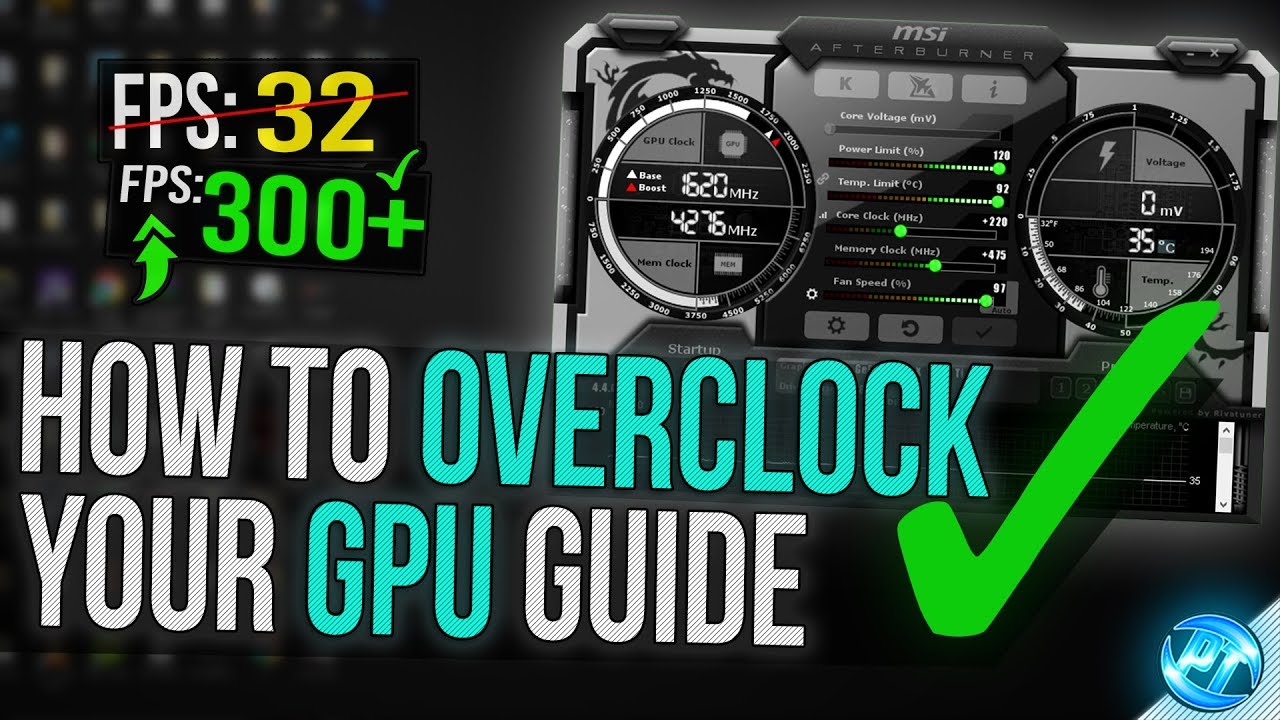
🔧 How To Overclock Your GPU - The Ultimate Easy Guide 2020
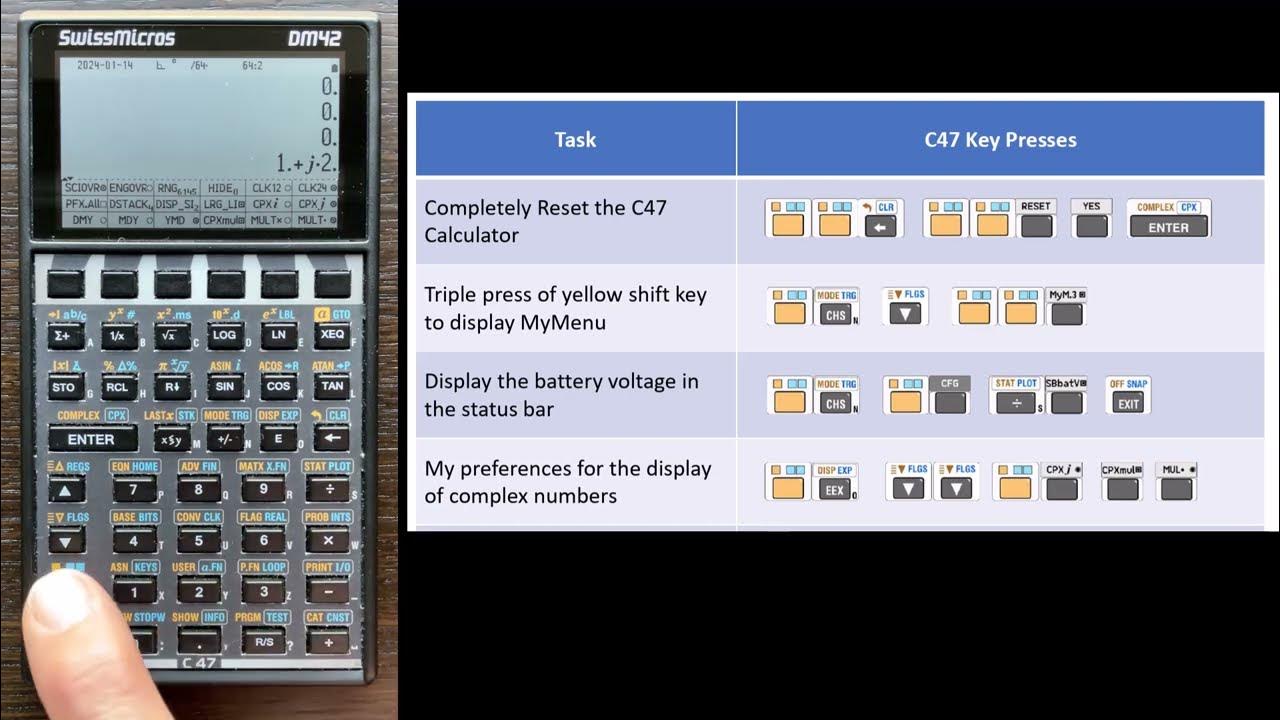
video 1, The C47 Calculator
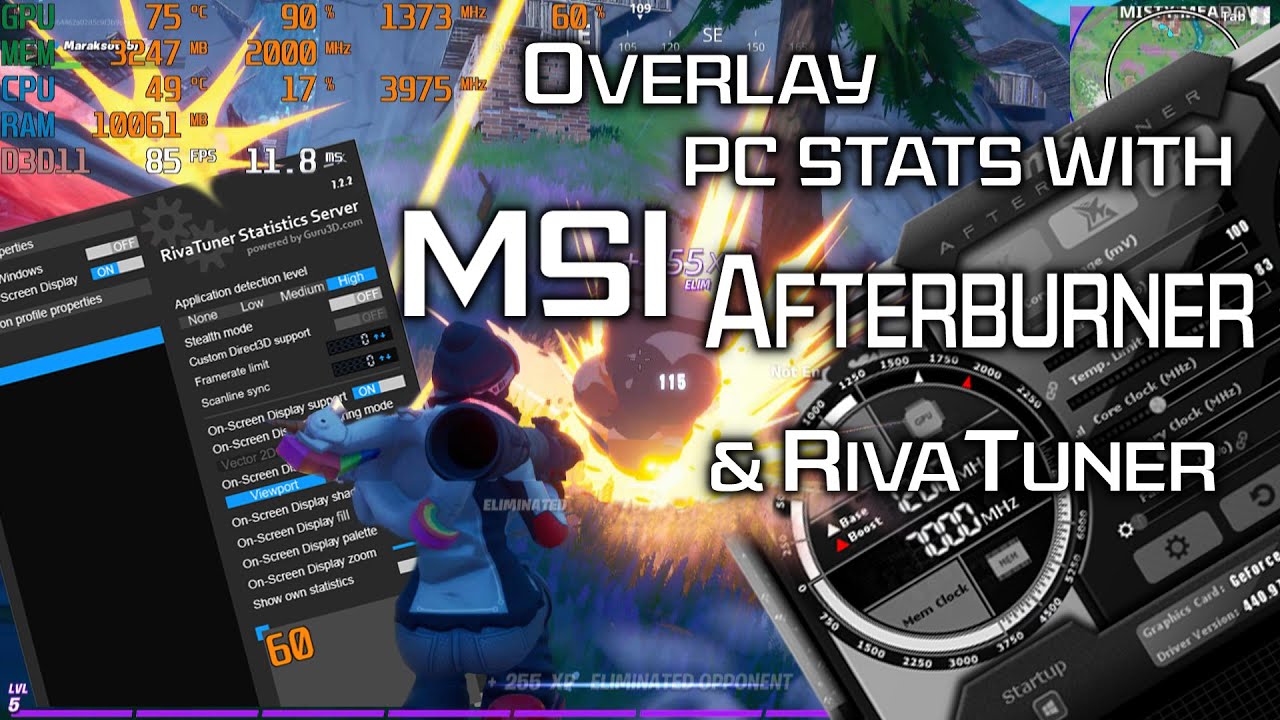
How to use MSI Afterburner and RivaTuner to Monitor CPU and GPU Statistics
🔧 Doing THIS can make your PC games PERFECTLY SMOOTH! *more fps & fix FPS stutter*✅
MSI Afterburner Settings Explained / AMD and NVIDIA!
5.0 / 5 (0 votes)
Thanks for rating: