Constructing a probability distribution for random variable | Khan Academy
TLDRThis video script explores the concept of a random variable, using the example of flipping a fair coin three times to determine the number of heads (X). It outlines the eight possible outcomes and calculates the probability of each scenario, resulting in a discrete probability distribution. The script explains the probabilities for getting zero, one, two, or three heads, which are 1/8, 3/8, 3/8, and 1/8 respectively. It visually represents these probabilities in a bar graph, illustrating the discrete nature of the distribution where the random variable X can only take on specific integer values, not any fractional or irrational numbers.
Takeaways
- 🎲 The video discusses the concept of a random variable 'X', defined as the number of heads obtained from three flips of a fair coin.
- 📊 The script aims to explore the probability distributions for the possible values of the random variable X.
- 🔢 There are eight possible outcomes when flipping a fair coin three times, each equally likely.
- 👉 The probability of getting zero heads (X = 0) is 1/8, as there is only one outcome (all tails) that results in no heads.
- 🎯 The probability of getting exactly one head (X = 1) is 3/8, with three outcomes contributing to this result.
- 🤔 The probability of getting two heads (X = 2) is also 3/8, with three different outcomes leading to exactly two heads.
- 🏆 The probability of getting three heads (X = 3) is 1/8, with only one outcome (all heads) achieving this.
- 📈 The script illustrates how to plot these probabilities on a graph with outcomes on the horizontal axis and probabilities on the vertical axis.
- 📊 The video constructs a discrete probability distribution for the random variable X, showing the likelihood of each possible value.
- 📝 The random variable X can only take on discrete values (0, 1, 2, 3) and not any fractional or irrational numbers.
- 📚 The final graph represents a discrete probability distribution, highlighting the probabilities of each discrete value that X can take.
Q & A
What is the definition of the random variable X in the context of the video?
-In the video, the random variable X is defined as the number of heads obtained after flipping a fair coin three times.
What is the purpose of discussing the probability distributions in the video?
-The purpose is to analyze the different possible outcomes or values for the random variable X and to visualize how the distribution is spread out among those outcomes.
How many possible outcomes are there when flipping a fair coin three times?
-There are eight possible outcomes when flipping a fair coin three times, as each flip has two possible results (heads or tails).
What is the probability of getting zero heads (X = 0) when flipping the coin three times?
-The probability of getting zero heads (X = 0), which corresponds to getting all tails, is 1 out of the eight equally likely outcomes, or 1/8.
How many outcomes result in exactly one head (X = 1), and what is the probability?
-There are three outcomes that result in exactly one head (HHT, HTH, THH), making the probability 3 out of the eight equally likely outcomes, or 3/8.
What are the possible values for the random variable X in this scenario?
-The possible values for the random variable X are 0, 1, 2, and 3, representing the number of heads obtained in three coin flips.
What is the probability of getting exactly two heads (X = 2) in the coin flips?
-The probability of getting exactly two heads (X = 2) is also 3 out of the eight equally likely outcomes, which is 3/8, as there are three such outcomes (HHT, HTH, THH).
What is the probability of getting all heads (X = 3) in the three coin flips?
-The probability of getting all heads (X = 3) is 1 out of the eight equally likely outcomes, which is 1/8, as there is only one outcome (HHH) that meets this condition.
How is the probability distribution of the random variable X visualized in the video?
-The probability distribution is visualized by plotting the possible values of X on the horizontal axis and their corresponding probabilities on the vertical axis, creating a bar graph.
What type of probability distribution is being discussed in the video?
-The video discusses a discrete probability distribution, where the random variable X can only take on specific discrete values and not any value within a range.
How does the video illustrate the concept of equally likely outcomes?
-The video illustrates the concept by showing that each of the eight possible outcomes of flipping a coin three times has the same chance of occurring, thus they are equally likely.
Outlines
🎲 Probability Distribution of Coin Flips
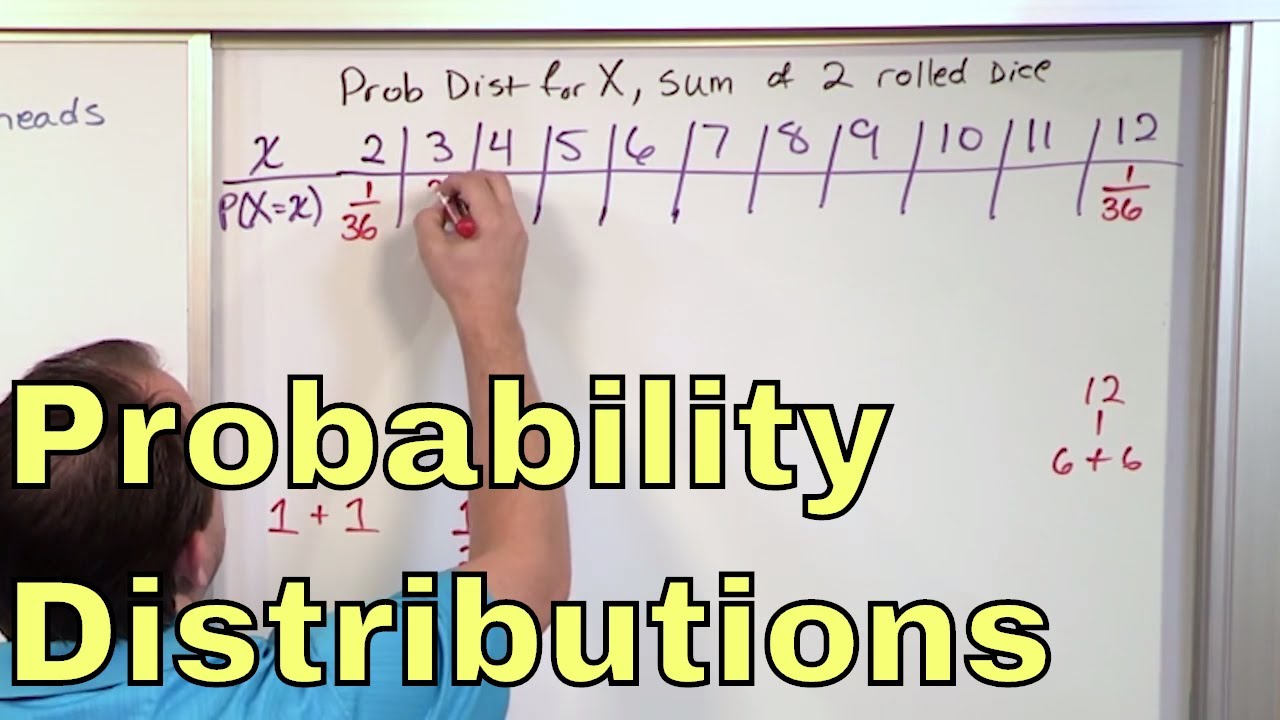
This paragraph introduces the concept of a random variable, denoted as capital X, representing the number of heads obtained from three flips of a fair coin. The video aims to explore the probability distribution of the different possible outcomes for X. It lists all eight possible outcomes of the coin flips and explains how they relate to the value of X. The probabilities of getting zero, one, two, or three heads are calculated, corresponding to 1/8, 3/8, 3/8, and 1/8 respectively. The paragraph concludes with a description of how to plot these probabilities on a graph with X values on the horizontal axis and probabilities on the vertical axis, setting the stage for visualizing the distribution.
📊 Constructing a Discrete Probability Distribution
The second paragraph delves into the process of constructing a discrete probability distribution for the random variable X, which represents the number of heads in three coin flips. It describes how to plot the probabilities of X taking on the values of zero, one, two, and three heads. Each probability is represented by a bar on the graph: 1/8 for zero heads, 3/8 for one and two heads, and 1/8 for three heads. The paragraph emphasizes that X can only take on discrete values and cannot be a fraction or an irrational number like pi. The result is a visual representation of the discrete probability distribution, highlighting the likelihood of each possible outcome for the random variable X.
Mindmap
Keywords
💡Random Variable
💡Probability Distribution
💡Fair Coin
💡Outcomes
💡Heads
💡Tails
💡Equally Likely Outcomes
💡Discrete Values
💡Probability
💡Bar Chart
💡Discrete Probability Distribution
Highlights
Introduction of a random variable X representing the number of heads after three flips of a fair coin.
Exploration of probability distributions for different possible outcomes of the random variable.
Listing all possible outcomes of flipping a fair coin three times (eight equally likely outcomes).
Calculating the probability of getting zero heads (1/8 chance).
Determining the probability of getting exactly one head (3/8 chance).
Analyzing the probability of obtaining two heads (also a 3/8 chance).
Calculating the probability of getting three heads (1/8 chance).
Explanation on how to plot the probability distribution for the random variable X.
Visual representation of the probability distribution with a vertical axis for probability.
Division of the probability scale into eighths for clarity.
Identification of possible values for X (0, 1, 2, 3).
Graphical depiction of probabilities for each value of X.
Construction of a discrete probability distribution for the random variable X.
Emphasis on X taking only discrete values, not any value between.
Final visualization of the discrete probability distribution for X.
Summary of the process to create a probability distribution for a discrete random variable.
Transcripts
Browse More Related Video

Binomial distribution | Probability and Statistics | Khan Academy

Visualizing a binomial distribution | Probability and Statistics | Khan Academy

Random variables | Probability and Statistics | Khan Academy
02 - Random Variables and Discrete Probability Distributions
5.1.2 Discrete Probability Distributions - Probability Distributions and Probability Histograms
Introduction to Discrete Random Variables and Discrete Probability Distributions
5.0 / 5 (0 votes)
Thanks for rating: