How to recognize relative and absolute maxima and minima | Functions | Algebra I | Khan Academy
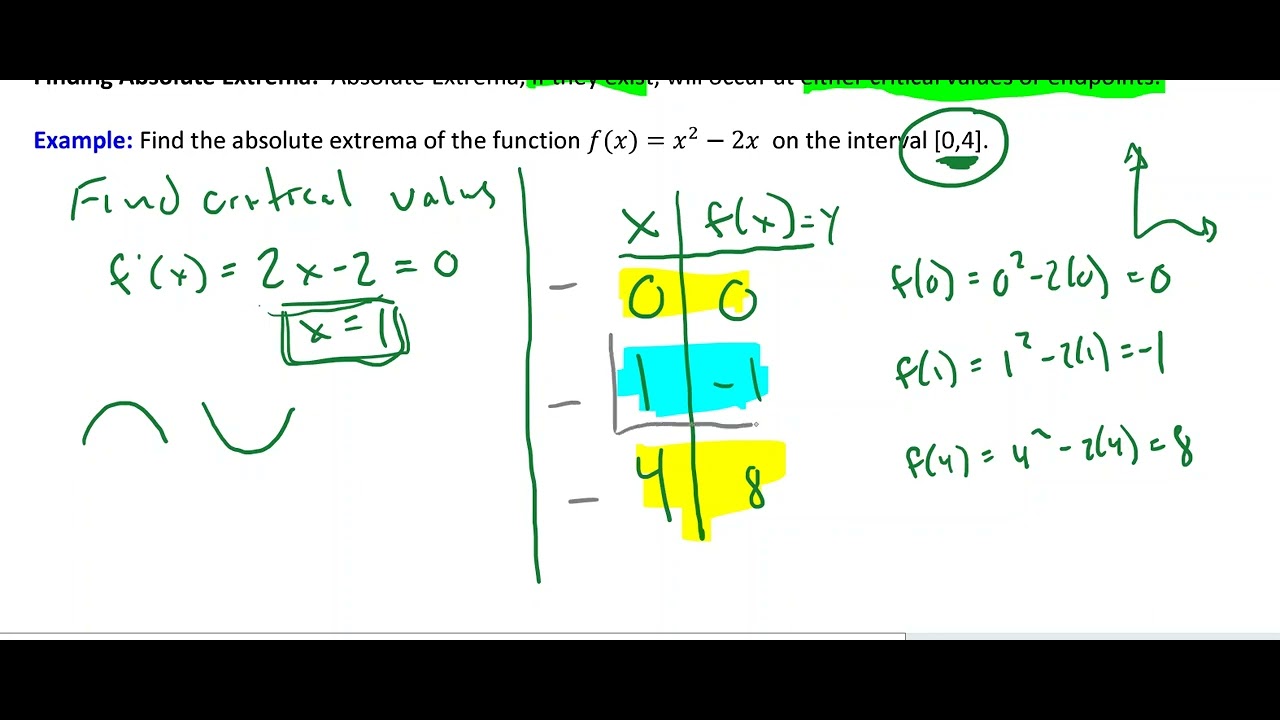
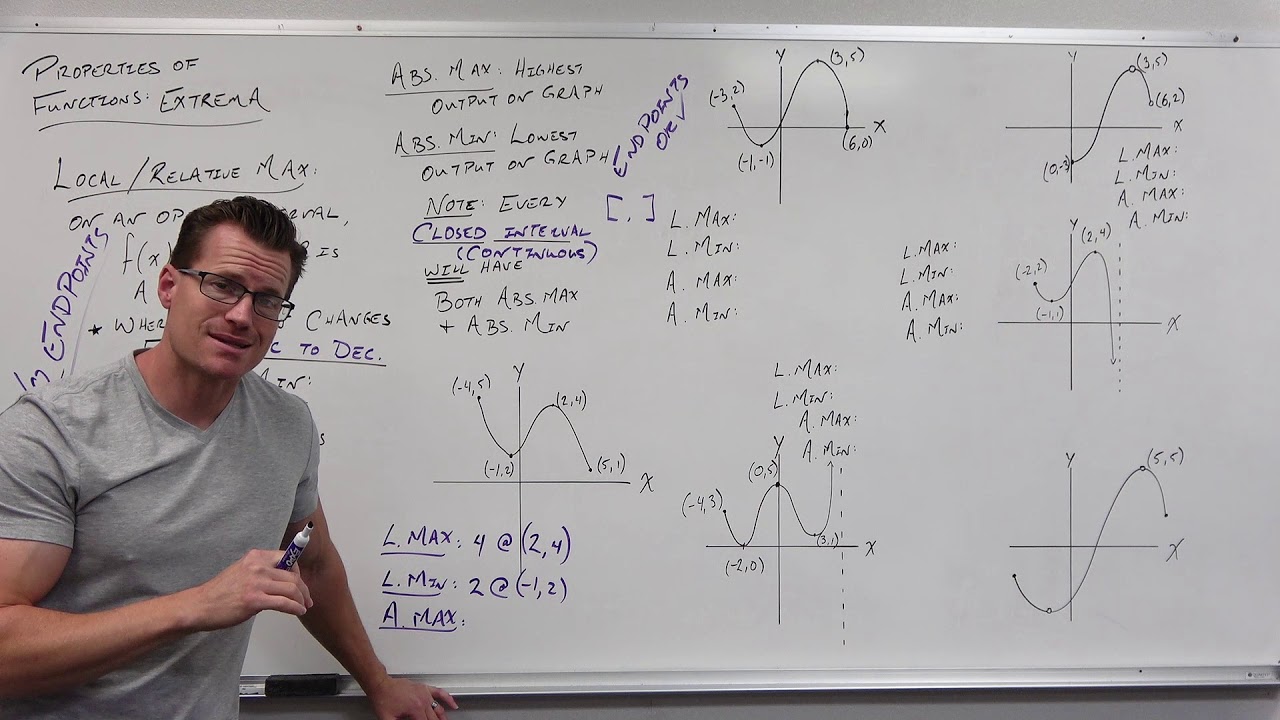
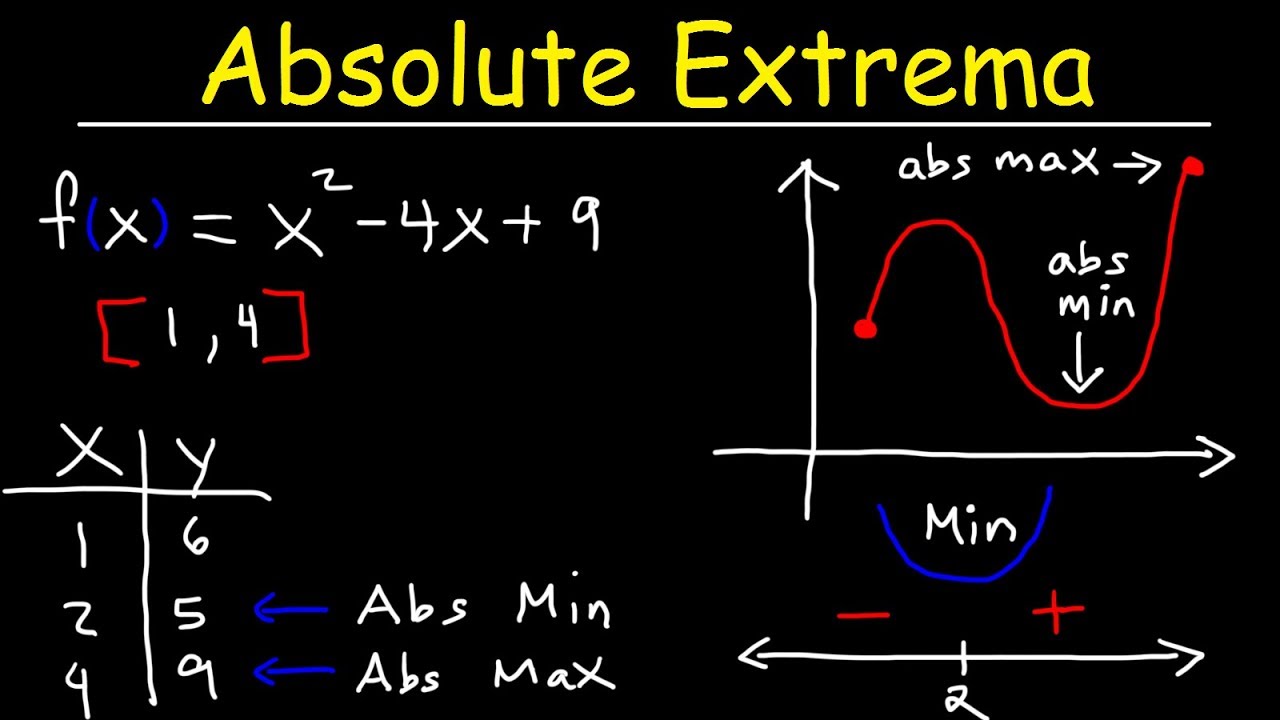
TLDRThis educational video script guides viewers on identifying relative and absolute extrema in a graph. It explains that relative extrema are points where the function's value is locally higher or lower than its surroundings, with relative maxima resembling hilltops and minima being valley bottoms. An edge case is when the graph is flat, indicating both a maximum and minimum. Absolute extrema are the highest and lowest points across the entire domain, often found at endpoints or where the function reaches its peak or trough. The script encourages viewers to practice identifying these points by pausing the video and attempting the task themselves.
Takeaways
- 📚 The video script discusses how to identify relative and absolute extrema in a graph.
- 🔍 Relative extrema include both maximum and minimum points, which are visually identifiable as peaks and valleys on a graph.
- 🏔️ A relative maximum is like the top of a hill, not necessarily the highest point in the domain.
- 🏞️ Similarly, a relative minimum is the bottom of a valley, which doesn't have to be the lowest point in the domain.
- 🔄 Edge cases for relative extrema occur when the graph is flat, meaning the function's value is constant.
- 📈 The instructor explains that a point is a relative extremum if it is at least as large or as small as the surrounding values.
- 📊 Absolute extrema are identified by comparing the function's value at a point to all other points in the domain.
- 🔑 Absolute maximum is the highest point on the curve, while absolute minimum is the lowest.
- 📐 The script mentions that absolute extrema can occur at the endpoints of the domain, unlike relative extrema.
- 🤔 An edge case for absolute extrema is when the function plateaus, making all points in that region potential absolute maxima.
- 👀 The video encourages viewers to pause and attempt to identify extrema themselves before the instructor provides the answers.
Q & A
What are the two types of relative extrema mentioned in the script?
-The two types of relative extrema mentioned are relative maximum points and relative minimum points.
How are relative maximum points visually represented in a graph?
-Relative maximum points are visually represented as the high points on a hill or the peak of a mountain, even if they are not the highest overall points in the graph.
How does the script describe relative minimum points?
-Relative minimum points are described as the bottom of valleys, which are the low points on the graph, even if there are other parts of the function that are lower.
What is the edge case for both relative maxima and relative minima as described in the script?
-The edge case for both relative maxima and minima is when the graph is flat, meaning the function is constant at certain points, and these points can be considered both a relative maximum and minimum.
How does the script differentiate between a relative extremum and the absolute extremum?
-The script differentiates by stating that a relative extremum is a high or low point compared to its immediate surroundings, while an absolute extremum is the highest or lowest point over the entire domain of the function.
What is the condition for a point to be considered an absolute maximum point?
-A point is considered an absolute maximum point if and only if the function's value at that point is greater than or equal to the function's value for all x's in the domain.
What is the condition for a point to be considered an absolute minimum point?
-A point is considered an absolute minimum point if and only if the function's value at that point is less than or equal to the function's value for all x's in the domain.
How does the script explain the identification of absolute extrema in a graph?
-The script explains that to identify absolute extrema, one should look for the highest point on the curve for the absolute maximum and the lowest point on the curve for the absolute minimum, which could also be at the endpoints of the domain.
What is an example of an edge case for absolute extrema mentioned in the script?
-An example of an edge case for absolute extrema is when the function increases and then remains flat; in such a case, any point in the flat region could be considered an absolute maximum point.
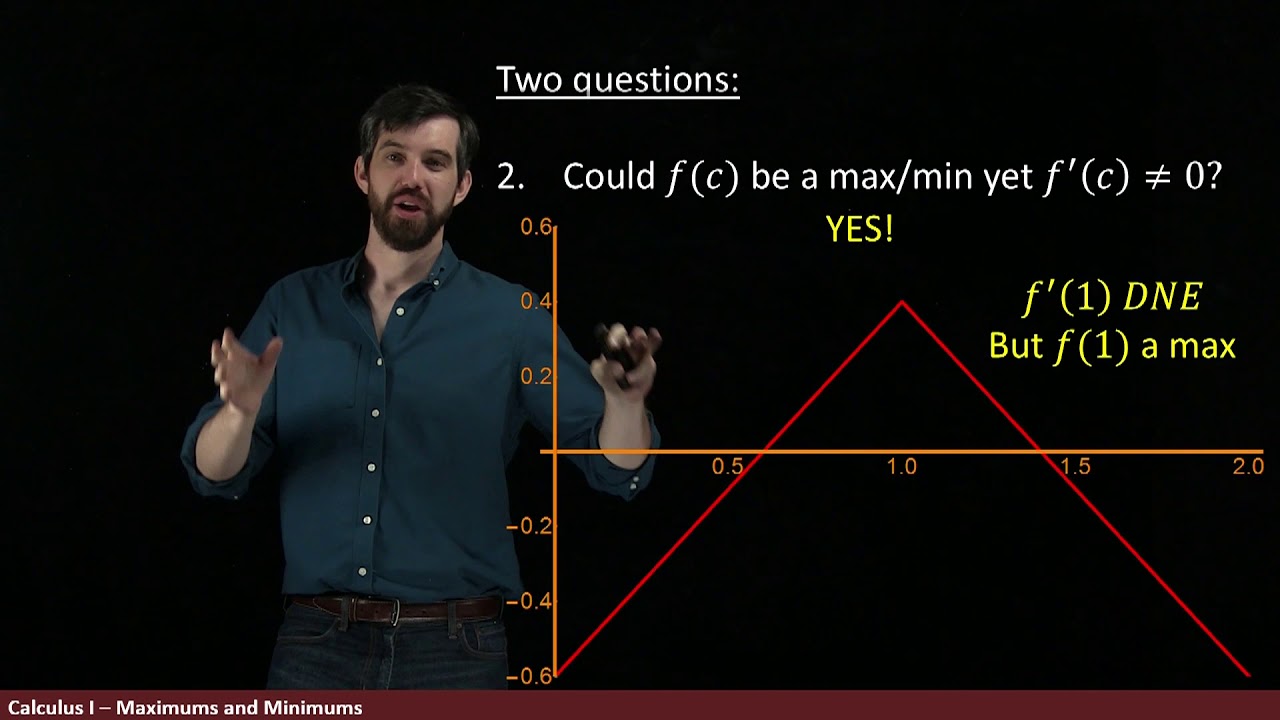
Why might a point not be considered a relative maximum even if it looks like a hilltop?
-A point might not be considered a relative maximum if, when looking to the right or left of the point, there are values that are higher, indicating it is not the top of a hill relative to its surroundings.
What is the significance of the term 'iff' used in the script?
-The term 'iff' stands for 'if and only if', which is used to denote the precise condition under which something is true or an event occurs, such as the conditions for absolute extrema.
Outlines
📊 Identifying Relative Extrema in Graphs
The instructor begins by inviting viewers to identify the relative extremum points in a graph. They explain that there are two types of relative extrema: maximum and minimum points. A relative maximum is depicted as the high point on a hill or the peak of a mountain, which does not necessarily have to be the highest point in the entire domain of the function. Similarly, a relative minimum is the bottom of a valley, which also doesn't have to be the lowest point overall. The instructor clarifies that these points are visually distinguishable, and they provide examples to illustrate the concept. They also mention an edge case where the graph is flat, indicating that such points can be considered both a relative maximum and minimum. The lesson continues with the identification of specific relative maximum and minimum points on the graph, emphasizing the importance of recognizing the correct 'top of the hill' or 'bottom of the valley' for each extremum.
Mindmap
Keywords
💡Relative extremum points
💡Relative maximum points
💡Relative minimum points
💡Flat graph
💡Absolute extrema
💡Domain of the function
💡High point
💡Endpoint of the domain
💡Edge case
💡Graph interpretation
💡Function value
Highlights
Introduction to identifying relative extrema in a graph.
Explanation of two types of relative extrema: relative maximum and minimum points.
Visual analogy of a relative maximum point as the top of a hill.
Clarification that relative extrema do not need to be the absolute highest or lowest points in the function's domain.
Description of relative minimum points as the bottom of valleys.
Introduction of an edge case for relative extrema where the graph is flat.
Criteria for a point to be considered a relative minimum when the function's value is at least as small as the surrounding values.
Identification of the first relative maximum point in the graph.
Distinguishing between potential relative extrema and actual ones based on the function's values to the left and right.
Identification of three relative minimum points in the graph.
Transition to discussing absolute extrema with an example.
Definition of an absolute maximum point in terms of the function's domain.
Definition of an absolute minimum point and its relation to the function's domain.
Identification of the absolute maximum point in the provided graph.
Identification of the absolute minimum point, noting its position at the domain's endpoint.
Edge case discussion for absolute extrema involving a flat region at the highest point of the function.
General strategy for identifying absolute extrema as the highest and lowest points on the curve.
Transcripts


5.0 / 5 (0 votes)
Thanks for rating: