Power Calculations in Hypothesis Testing | Statistics Tutorial #17 | MarinStatsLectures
TLDRThis video script delves into the concepts of Type 1 and Type 2 errors, and the power of hypothesis testing, focusing on a one-mean test. It simplifies the explanation by using a hypothetical drug trial for blood pressure and emphasizes the importance of understanding power and its calculation. The script explains how alpha level, sample size, and the effect size influence power, advocating for a priori sample size calculations to ensure adequate power, typically aiming for 80-95%, to detect true effects.
Takeaways
- 🔍 The video discusses Type 1 and Type 2 errors, as well as the concept of power in the context of hypothesis testing for a single mean.
- 📚 The script emphasizes the importance of understanding power and its calculation, rather than just the calculation itself.
- 💊 It uses a hypothetical example involving a drug's effect on systolic blood pressure to illustrate the concepts.
- 🚫 A Type 1 error occurs when we incorrectly reject the null hypothesis, believing a drug is effective when it is not.
- 🔄 Conversely, a Type 2 error happens when we fail to reject the null hypothesis, missing the fact that the drug is actually effective.
- 📉 Power is defined as the probability of correctly rejecting the null hypothesis when the alternative is true, indicating the test's ability to detect an effect.
- 🎯 Factors affecting power include the chosen alpha level, sample size, and the effect size we wish to detect.
- 📈 Increasing the alpha level (e.g., from 5% to 10%) increases power by shifting the rejection threshold, thus reducing the Type 2 error rate.
- 🔎 A larger sample size decreases the standard error, narrowing the sampling distribution and increasing power by making it easier to detect an effect.
- 🔑 The desired effect size, or the difference we aim to detect, directly impacts power; larger effects require smaller sample sizes for detection.
- 🛠 Calculating power is crucial for determining the appropriate sample size before data collection to ensure the study has a high likelihood of detecting an effect if it exists.
Q & A
What are Type 1 and Type 2 errors in the context of hypothesis testing?
-Type 1 error occurs when we incorrectly reject the null hypothesis when it is actually true, suggesting an effect when there is none. Type 2 error happens when we fail to reject the null hypothesis when it is false, meaning we miss an actual effect.
What is the significance of 'power' in hypothesis testing?
-Power in hypothesis testing is the probability of correctly rejecting the null hypothesis when the alternative hypothesis is true. It measures the test's ability to detect an effect if there is one.
Why is it important to understand the concept of power in hypothesis testing?
-Understanding the concept of power is crucial because it helps determine the likelihood of detecting an effect if it exists, and it is a key factor in designing studies to ensure they are adequately powered to detect important effects.
What factors affect the power of a hypothesis test?
-The power of a hypothesis test is affected by the significance level (alpha), the sample size, and the effect size (the difference we wish to detect).
How does increasing the alpha level impact the power of a test?
-Increasing the alpha level increases the power of the test because it raises the probability of rejecting the null hypothesis, thus reducing the chance of a Type 2 error.
What is the relationship between sample size and the power of a hypothesis test?
-Increasing the sample size decreases the standard error, which narrows the sampling distribution and increases the power of the test, making it more likely to detect an effect if it exists.
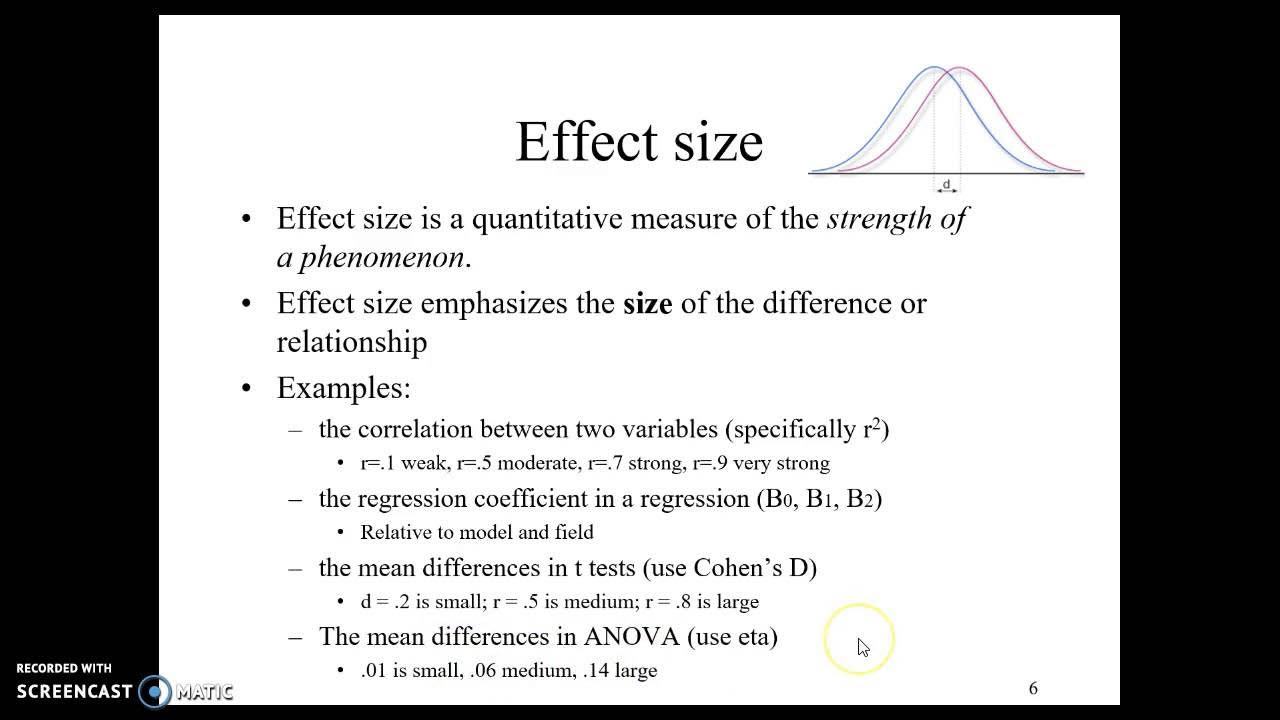
How does the effect size influence the power of a test?
-A larger effect size makes it easier to detect a difference between the null and alternative hypotheses, thus increasing the power of the test. Conversely, a smaller effect size requires a larger sample size to achieve the same power.
What is a one-sided hypothesis test, and why might it be used?
-A one-sided hypothesis test is a test where the alternative hypothesis specifies that the parameter is either greater than or less than the null value, but not both. It is used to simplify the analysis and focus on detecting an effect in one direction.
Why might researchers choose to use the Z-distribution instead of the T-distribution in certain situations?
-Researchers might choose to use the Z-distribution instead of the T-distribution to simplify calculations, especially when the population standard deviation is known and the sample size is large, making the sampling distribution approximately normal.
What is the role of the critical value in hypothesis testing?
-The critical value in hypothesis testing is the threshold value that determines whether to reject the null hypothesis. If the test statistic falls beyond this value (in the direction of the alternative hypothesis), the null hypothesis is rejected.
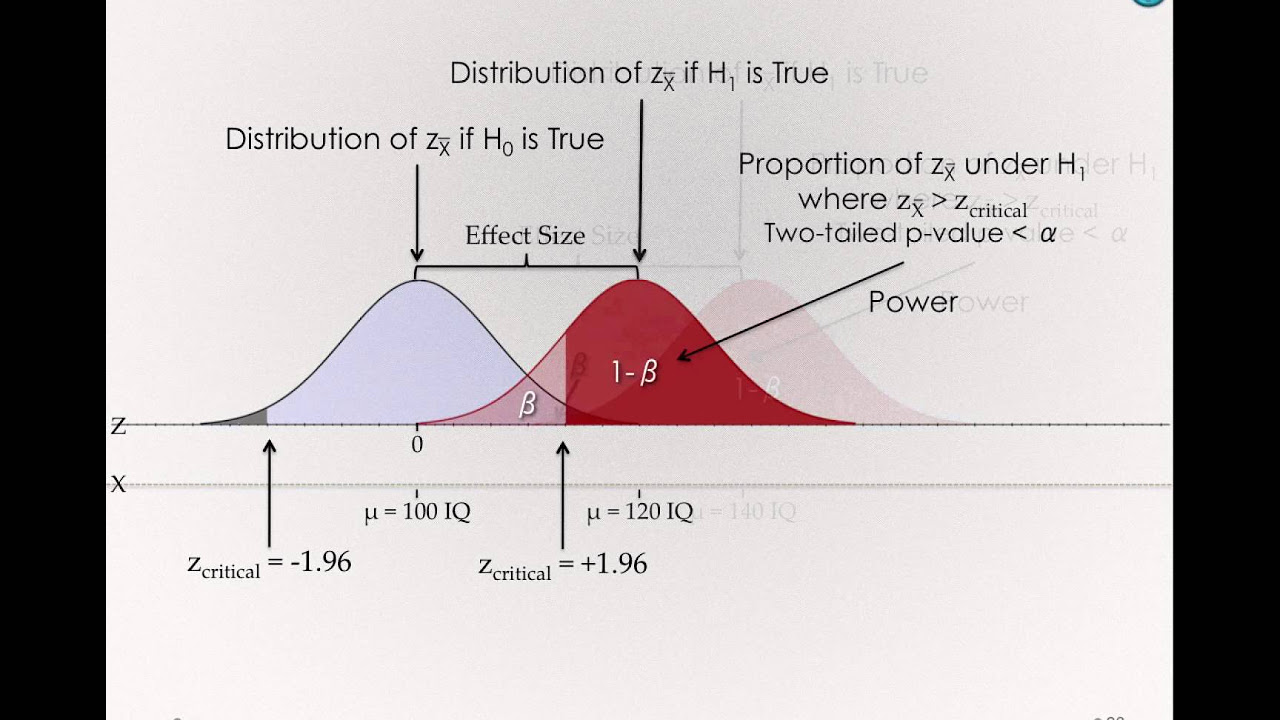
How can researchers calculate the Type 2 error rate (beta) and power numerically?
-Researchers can calculate the Type 2 error rate and power by standardizing the difference between the hypothesized mean under the alternative and the critical value, then using a Z-table or software to find the corresponding probabilities.
Outlines
🔍 Introduction to Type 1 and Type 2 Errors and Power
This paragraph introduces the concepts of Type 1 and Type 2 errors and the statistical power of a hypothesis test. It sets the stage for a detailed discussion on these topics, particularly focusing on the hypothesis test for one mean. The speaker emphasizes the importance of understanding the concept of power and its calculation, rather than just the calculation itself. The video will use a simplified example involving a drug's effect on blood pressure, with a known population mean and standard deviation, to illustrate these concepts.
📉 Hypothesis Testing and Rejection Criteria
The speaker explains the process of hypothesis testing, focusing on the rejection of the null hypothesis. They use a one-sided test with an alpha level of 5%, which corresponds to a critical Z value of -1.65. The paragraph details how to calculate the sample mean that would lead to the rejection of the null hypothesis, given the population parameters and sample size. It also introduces the concept of critical values and their role in hypothesis testing.
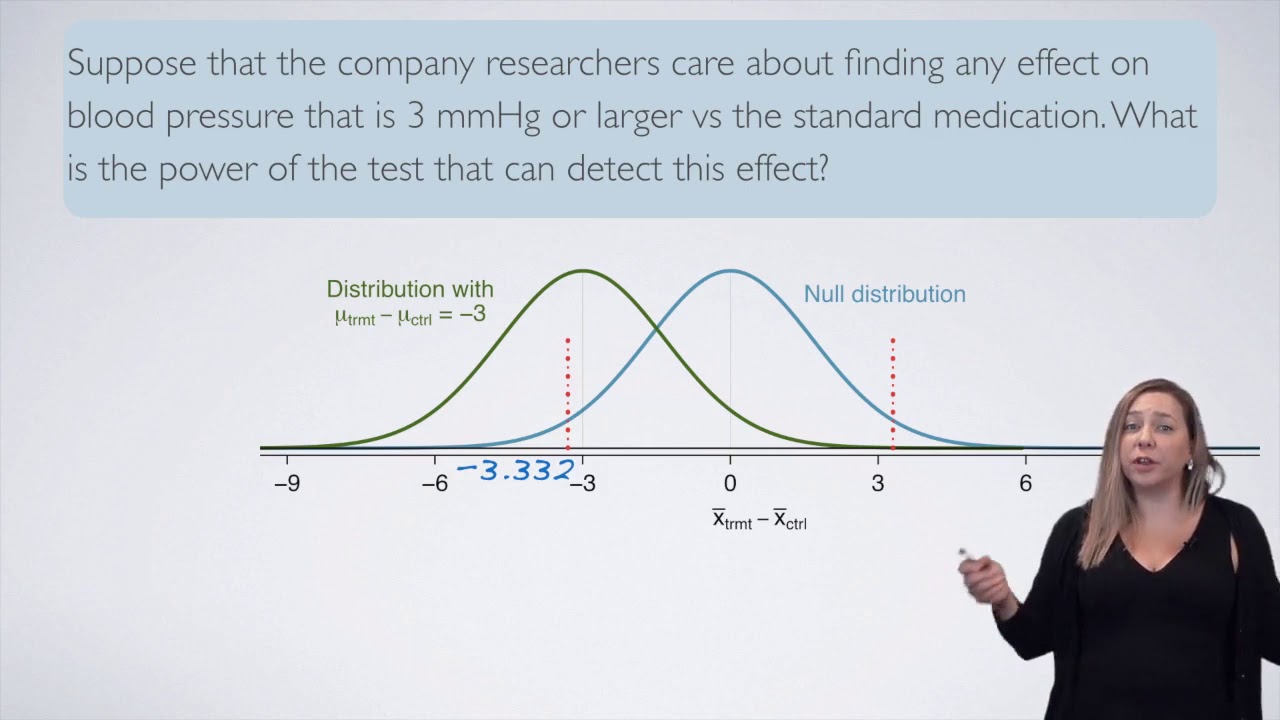
🧐 Calculating Type 2 Error Rate and Power
This paragraph delves into the calculation of the Type 2 error rate (beta) and the power of a test. The speaker assumes a specific value for the mean under the alternative hypothesis and calculates the probability of failing to reject the null hypothesis when it is false. They also explain how to numerically determine the power, which is the probability of correctly rejecting the null hypothesis when the alternative is true. The importance of the concepts over the actual calculations is reiterated.
🔑 Factors Influencing Power and Type 2 Error Rate
The final paragraph discusses the three main factors that influence the power of a test and the Type 2 error rate: alpha level, sample size, and the effect size (the difference we wish to detect). The speaker explains how increasing alpha decreases the Type 2 error rate and increases power, how increasing the sample size narrows the sampling distribution and thus increases power, and how looking for a larger effect size can also increase power. The paragraph concludes by emphasizing the importance of understanding these concepts and controlling them to ensure adequate power in statistical tests.
Mindmap
Keywords
💡Type 1 Error
💡Type 2 Error
💡Power
💡Hypothesis Test
💡Null Hypothesis
💡Alternative Hypothesis
💡Sample Size
💡Standard Error
💡Z-distribution
💡Effect Size
💡Alpha Level
Highlights
Introduction to Type 1 and Type 2 errors, power, and factors affecting them in the context of hypothesis testing for a single mean.
Emphasis on understanding the concept of power rather than the calculation itself.
Explanation of using software for more complex power calculations instead of manual formula plugging.
Hypothetical scenario involving a hypertensive population and a drug's effect on blood pressure.
Null hypothesis setup assuming the drug has no effect on blood pressure.
Alternative hypothesis positing that the drug significantly reduces blood pressure.
One-sided hypothesis test simplification using Z-distribution instead of T-distribution.
Calculation of the critical Z-value for a 5% significance level.
Derivation of the sample mean threshold for rejecting the null hypothesis.
Conceptual explanation of Type 1 and Type 2 errors in the context of the sample mean.
Numerical calculation of the Type 2 error rate (beta) given an alternative hypothesis mean.
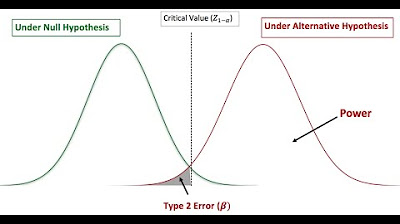
Graphical representation of power and Type 2 error rate on a normal distribution curve.
The impact of increasing alpha on reducing the Type 2 error rate and increasing power.
Effect of increasing sample size on decreasing standard error and increasing power.
Importance of specifying the effect size when calculating power and Type 2 error rate.
Practical implications of effect size on the ease of detecting a drug's impact on blood pressure.
Recommendation to perform sample size calculations ahead of data collection for adequate power.
The trade-off between Type 1 and Type 2 error rates and the strategic choice of alpha.
Importance of understanding the underlying concepts of power in statistical hypothesis testing.
Transcripts
Browse More Related Video
5 4 Power Calculations for difference of two means
Power and Sample Size Calculation

Introduction to power in significance tests | AP Statistics | Khan Academy
Power & Effect Size
Factors Affecting Power - Effect size, Variability, Sample Size (Module 1 8 7)

HYPOTHESIS TESTING BASICS: Type 1/Type 2 errors | Statistical power
5.0 / 5 (0 votes)
Thanks for rating: