Type I and II Errors, Power, Effect Size, Significance and Power Analysis in Quantitative Research
TLDRThis script explores the fundamentals of quantitative research, emphasizing the role of hypotheses and the null hypothesis. It explains the importance of disproving the null hypothesis to support a research hypothesis and introduces the concept of type I and type II errors, which are mistakes made in the decision process regarding the null hypothesis. The script also delves into statistical considerations such as power, effect size, and significance level, which are crucial for determining sample size and the likelihood of errors. It concludes by highlighting the difference between statistical and practical significance, urging researchers to consider the meaningfulness of their findings.
Takeaways
- 🔍 Quantitative research involves testing hypotheses against a null hypothesis, which assumes no relationship between variables.
- ❌ The null hypothesis states there is no relationship or effect, serving as a baseline to compare against the research hypothesis.
- 📉 To support a hypothesis, researchers must refute the null hypothesis, demonstrating it is unlikely to be true rather than proving their hypothesis directly.
- 🤔 Two types of errors can occur in research: Type I (falsely rejecting the null hypothesis when it is true) and Type II (falsely accepting the null hypothesis when it is false).
- 👤 Type I errors are about mistakenly finding a relationship that doesn't exist, while Type II errors are about failing to find a relationship that does exist.
- 🧠 Remembering Type I and II errors can be aided by analogies, such as a court case or medical testing, to help differentiate between rejecting and accepting the null hypothesis.
- 💪 Power in a study is the probability of correctly rejecting a false null hypothesis, aiming to avoid Type II errors, and is influenced by sample size, effect size, and significance level.
- 📊 Effect size measures the magnitude of the difference between groups and is crucial for determining the meaningfulness of results beyond statistical significance.
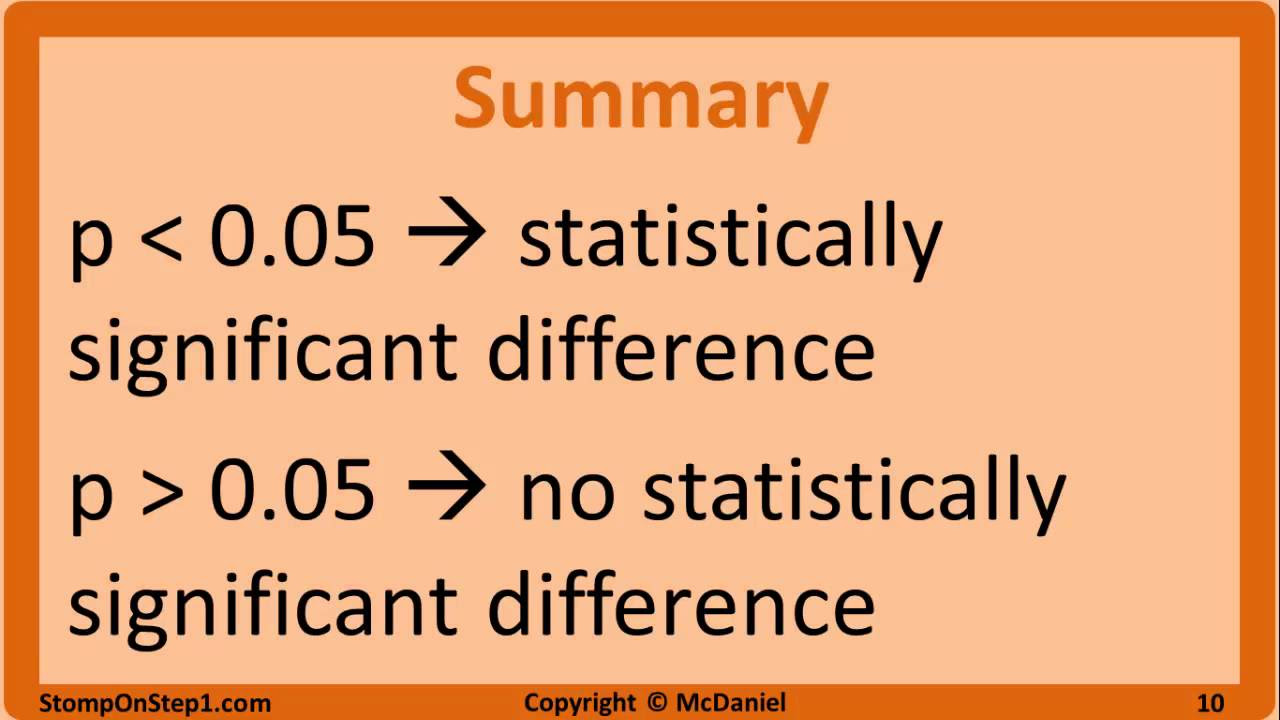
- 🎯 Significance level (alpha) is the threshold for determining if results are statistically significant, with a common value of 0.05, indicating a 5% risk of a Type I error.
- 🔄 There is a trade-off between Type I and Type II errors; lowering the risk of one increases the risk of the other, requiring a balance before conducting a study.
- 📚 Understanding statistical significance, effect size, and power is essential for interpreting research findings and determining their practical significance.
Q & A
What is the null hypothesis in quantitative research?
-The null hypothesis is the default assumption that there is no relationship between the variables being tested, and any observed results are due to random chance events.
What is the research hypothesis?
-The research hypothesis is the researcher's best guess or prediction about the relationship between variables, which is the opposite of the null hypothesis.
How does a researcher support their hypothesis?
-A researcher supports their hypothesis by refuting the null hypothesis. They must show that the assumption of no relationship is likely to be wrong.
What are the two major types of errors in quantitative research?
-The two major types of errors are Type I and Type II errors. Type I error is when the null hypothesis is mistakenly rejected when it is true, and Type II error is when the null hypothesis is mistakenly accepted when it is false.
What is the difference between Type I and Type II errors?
-A Type I error occurs when a researcher finds a relationship where there is none (false positive), while a Type II error occurs when a researcher fails to find a relationship that actually exists (false negative).
Why is statistical power important in a study?
-Statistical power is the probability that a study will correctly reject a false null hypothesis, thus avoiding a Type II error. Higher power reduces the risk of missing a true effect.
What factors influence the statistical power of a study?
-Statistical power is influenced by sample size, effect size, and the significance level. Larger sample sizes, larger effect sizes, and lower significance levels generally increase power.
What is the significance level in a study?
-The significance level, often denoted by alpha, is the probability threshold for deciding that the null hypothesis is false when it is actually true. It represents the maximum acceptable risk of a Type I error.
How is effect size calculated and what does it represent?
-Effect size is a standardized measure that represents the magnitude of the influence one variable has on another. It is calculated in standard deviations and indicates the degree to which the null hypothesis is false.
What is the relationship between statistical significance and practical significance?
-Statistical significance indicates that a result is unlikely to have occurred by chance, but it does not necessarily imply practical significance. Practical significance relates to the relevance and magnitude of the findings in a real-world context.
Why do researchers conduct a power analysis before starting a study?
-A power analysis helps determine the necessary sample size to achieve a desired level of statistical power. It ensures that the study has a reasonable chance of detecting an effect if one exists.
How can one remember the difference between Type I and Type II errors?
-One can remember the difference by associating Type I error with mistakenly believing a relationship exists (like convincing a stubborn person they are wrong), and Type II error with failing to recognize an existing relationship (like failing to convince a stubborn person they are right).
Outlines
🔍 Understanding Hypotheses and Null Hypothesis
The first paragraph introduces the concept of quantitative research, focusing on the formulation of research questions and hypotheses. It explains the role of the null hypothesis, which is the default assumption of no relationship between variables being tested. The paragraph clarifies that the null hypothesis is inherently the opposite of the research hypothesis and that the goal is to disprove the null to support the research hypothesis. The concept of errors in research, specifically Type I and Type II errors, is introduced, with Type I errors occurring when the null hypothesis is wrongly rejected and Type II errors when it is wrongly accepted. The paragraph uses the analogy of a stubborn person to help differentiate between the two types of errors.
📊 Statistical Considerations in Quantitative Research
The second paragraph delves into the statistical aspects of quantitative research, emphasizing the importance of determining the appropriate sample size. It discusses the concept of 'power', which is the probability of correctly rejecting a false null hypothesis and thus avoiding a Type II error. The paragraph also addresses the significance of effect size, which measures the magnitude of the influence one variable has on another, and how it is used in power analysis to calculate the necessary sample size. Additionally, the alpha level, which represents the maximum acceptable probability of making a Type I error, is explained. The relationship between statistical significance and practical significance is highlighted, noting that a statistically significant result does not necessarily equate to a meaningful one. The paragraph concludes by discussing the inverse relationship between Type I and Type II errors and the importance of balancing these in research design.
Mindmap
Keywords
💡Quantitative research
💡Null hypothesis
💡Research hypothesis
💡Type I error
💡Type II error
💡Statistical power
💡Effect size
💡Significance level
💡P value
💡Practical significance
Highlights
Quantitative research is driven by research questions and hypotheses.
The null hypothesis is always the opposite of the research hypothesis and does not need to be explicitly stated.
Researchers compare their hypothesis to the null hypothesis to demonstrate its validity.
The null hypothesis asserts that variables being tested are unrelated and results are due to random chance.
Type I and Type II errors are two major types of errors in quantitative research.
Type I error occurs when the null hypothesis is mistakenly rejected, finding a non-existent relationship.
Type II error occurs when the null hypothesis is mistakenly accepted, missing a real relationship.
The likelihood of making an error is related to statistical considerations used to determine the needed sample size.
Power is the probability of correctly rejecting a false null hypothesis, avoiding a Type II error.
Effect size measures the magnitude of influence one variable has on another.
Statistical significance determines the likelihood that study results are due to chance.
Alpha level represents the acceptable error rate for rejecting the null hypothesis.
P values are calculated from sample data and compared to the alpha level to determine statistical significance.
Practical significance relates to the relevance of the findings to the research question.
Power analysis is used to calculate sample size, effect size, significance level, or power.
Researchers must balance the values for alpha and power to determine appropriate study parameters.
Statistically significant results do not always equate to practical significance.
Transcripts
Browse More Related Video
Type I error vs Type II error

Introduction to power in significance tests | AP Statistics | Khan Academy
Introduction to Type I and Type II errors | AP Statistics | Khan Academy
Statistical POWER and Power Analysis
Null Hypothesis, p-Value, Statistical Significance, Type 1 Error and Type 2 Error
8.1.2 Basics of Hypothesis Testing - Significance Level, Type I and Type II Error
5.0 / 5 (0 votes)
Thanks for rating: