Is the Logistic Map hiding in the Mandelbrot Set? | #SoME3
TLDRThe video script delves into the fascinating world of fractals, specifically exploring the relationship between the Mandelbrot set and bifurcation diagrams, particularly the logistic map. It explains that while both involve iterated functions, they are distinct, with the Mandelbrot set using a quadratic map with complex numbers and the logistic map using a real-valued function. The video clarifies that although they are separate, they share a common feature: the Feigenbaum constant, which is a universal ratio found in bifurcation diagrams of certain maps with a single locally quadratic maximum. The script also discusses the creation of 3D bifurcation diagrams and escape time fractals, highlighting the complexity and beauty of these mathematical phenomena.
Takeaways
- 🌀 The Mandelbrot set is a well-known fractal, and bifurcation diagrams also exhibit fractal behavior, particularly the bifurcation diagram for the logistic map.
- 📈 A bifurcation diagram is a graphical tool used to understand the behavior of an iterated function, such as the logistic map, by varying a parameter, typically denoted as 'r'.
- 🔄 Iterating a function involves applying it repeatedly to an initial value, generating a sequence of values that can reveal the function's behavior over time.
- 📊 Bifurcation diagrams for multiple values of 'r' can be visualized by plotting multiple iterations on a single graph, with 'r' represented on a horizontal axis.
- 🌐 The Mandelbrot set involves iterating a quadratic map with a complex number as input, which allows for a more intricate pattern of divergence and convergence.
- 🔲 The coloring of the Mandelbrot set is based on escape time, indicating how quickly a value diverges from a certain circle, creating a fractal image with a distinct black region for values that never diverge.
- 🚫 Values that cause the iterates to diverge to infinity are not plotted in the Mandelbrot set, which corresponds to the colored regions of the escape time fractal.
- 📉 The logistic map bifurcation diagram and the Mandelbrot set are related in that they both involve quadratic functions, but they are distinct and not identical.
- 🔢 The Feigenbaum constant is a universal number that appears in the ratios of successive bifurcation intervals for certain types of maps with a single locally quadratic maximum.
- 🔍 The 3D bifurcation diagram for the quadratic map, when limited to real inputs, reveals the hidden 2D bifurcation diagram for the map.
- 🧮 Calculating the Feigenbaum constant requires high precision in identifying bifurcation points, which is not trivial and may not be readily available for all maps.
- 🔬 The logistic map and the Mandelbrot set, while separate, share a common mathematical foundation and can provide insights into the behavior of complex dynamical systems.
Q & A
What is the Mandelbrot set?
-The Mandelbrot set is a well-known fractal, formed by iterating a quadratic function and plotting points based on whether their sequence remains bounded or diverges to infinity.
What is a bifurcation diagram?
-A bifurcation diagram is a graphical tool used to understand the behavior of an iterated function, showing how the function's iterates change with different parameter values.
What is the logistic map?
-The logistic map is a mathematical model used in the study of population dynamics and is an example of an iterated function that can be plotted on a bifurcation diagram.
How does the logistic map relate to the Mandelbrot set?
-The logistic map and the Mandelbrot set are both quadratic functions, but they are separate entities. They are related in the sense that they both exhibit fractal behavior and share a common mathematical constant, the Feigenbaum constant.
What is the Feigenbaum constant?
-The Feigenbaum constant is a universal number that appears in the study of bifurcation diagrams for certain types of maps with a single locally quadratic maximum. It represents the ratio of successive intervals between bifurcation points.
How does the iteration process work for the Mandelbrot set?
-For the Mandelbrot set, an initial complex number C is iterated using the quadratic map. If the sequence of iterates diverges (goes outside a certain circle), the iteration stops, and the point is colored based on the number of iterations before divergence.
What is an escape time fractal?
-An escape time fractal is a type of fractal where the coloring of each point is determined by the number of iterations it takes for the sequence to 'escape' a predefined region, such as a circle.
How does the 3D bifurcation diagram for the quadratic map relate to the Mandelbrot set?
-The real part of the 3D bifurcation diagram for the quadratic map, when viewed from above, resembles the Mandelbrot set. Points that do not diverge are not plotted, which corresponds to the colored parts of the escape time fractal.
What is the significance of the quadratic map starting at Z naught equals zero?
-Starting the quadratic map at Z naught equals zero is significant because 0 is a minimum for the quadratic map, which influences the behavior of the iterates and their visualization in the fractal.
What is the relationship between the logistic map's bifurcation diagram and the escape time fractal for the logistic map?
-The escape time fractal for the logistic map is a visualization that shows the chaotic behavior corresponding to the bifurcation diagram. It plots points based on the number of iterations before the sequence remains bounded or diverges.
How does the bifurcation diagram for the logistic map differ from that of the quadratic map?
-The bifurcation diagram for the logistic map has a real input and shows a different pattern of bifurcations. It also has two areas with chaotic behavior, which correspond to the two needles of the Mandelbrot set when considering the escape time fractal.
Outlines
🌀 Understanding Bifurcation Diagrams and the Mandelbrot Set
The first paragraph introduces the concept of bifurcation diagrams and their relationship with fractals, specifically the Mandelbrot set. It discusses the logistic map as an iterated function and how varying the parameter 'r' can change the behavior of the function's iterates. The paragraph explains the process of creating a bifurcation diagram by iterating the logistic map function for multiple values of 'r' and observing the behavior of the iterates. It also touches on the Mandelbrot set, which involves iterating a complex-valued function called the quadratic map. The description of the Mandelbrot set includes the process of coloring points based on the number of iterations before the sequence diverges from a circle, creating an escape time fractal.
📈 Combining Bifurcation Diagrams and the Mandelbrot Set
The second paragraph delves into the possibility of combining the Mandelbrot set with bifurcation diagrams, leading to a 3D representation. It begins by discussing the plotting of points in a plane for the quadratic map and the challenges of representing complex numbers in a one-dimensional space. The paragraph then describes the creation of a 3D bifurcation diagram by plotting both the real and imaginary parts of the iterates. It highlights the similarities between the 2D bifurcation diagram of the quadratic map and the Mandelbrot set when viewed from above. The discussion also includes the observation of columns along the real line of the complex plane, which resemble the logistic map's bifurcation diagram. The paragraph concludes by addressing the animation that combines elements of both sets and diagrams, and how it can be misleading without context.
🔍 The Feigenbaum Constant and Universality in Bifurcation Diagrams
The final paragraph explores the Feigenbaum constant, a mathematical constant that appears in the study of bifurcation diagrams. It explains that the constant is derived from measuring the length between successive bifurcations in the logistic map and taking the ratio of these lengths. The paragraph reveals that this constant is universal for all maps with a single locally quadratic maximum, which is a specific type of 'hump' in the function's graph. It also mentions that while the Feigenbaum constant is applicable to a broad family of maps, not all maps adhere to it. The video concludes by stating that although the logistic map is not hidden within the Mandelbrot set, there is a relationship between them due to their shared quadratic nature. The paragraph also expresses an intention to create more content on this topic in the future.
Mindmap
Keywords
💡Mandelbrot Set
💡Bifurcation Diagram
💡Logistic Map
💡Quadratic Map
💡Iterates
💡Escape Time Fractal
💡Feigenbaum Constant
💡Complex Numbers
💡Chaos Theory
💡Dynamical System
💡Fractal
💡Color Palette
Highlights
The Mandelbrot set and bifurcation diagrams both exhibit fractal behavior.
A bifurcation diagram is a plot that helps understand the behavior of an iterated function, such as the logistic map.
The logistic map and Mandelbrot set involve iterating functions with different initial values to observe changes in behavior.
The Mandelbrot set involves iterating the quadratic map with complex inputs, allowing iterates to move off the real line.
For the Mandelbrot set, points are colored based on how many iterations it takes for the sequence to diverge from a circle.
The real part of the 3D bifurcation diagram for the quadratic map resembles the Mandelbrot set from above.
The logistic map and Mandelbrot set are separate maps but share a common quadratic function form.
The bifurcation diagram for the logistic map shows chaotic behavior in certain parameter ranges, corresponding to the 'needle' in the Mandelbrot set.
The Feigenbaum constant, a ratio of successive bifurcation intervals, is universal for maps with a single locally quadratic maximum.
The Feigenbaum constant does not apply to all maps - it is specific to those with a certain 'hump' shape.
The logistic map and Mandelbrot set are related in that they both involve quadratic functions, but are distinct maps.
The 3D bifurcation diagram for the logistic map, when viewed from the side, reveals the chaotic parts of the 2D bifurcation diagram.
The bifurcation diagram and escape time fractal for the logistic map show surprising similarities to the Mandelbrot set.
The imaginary part of the 3D bifurcation diagram for the logistic map is zero for real inputs.
The bifurcation diagram and escape time fractal for the quadratic map also share similarities with the Mandelbrot set.
While the logistic map is not 'hidden' in the Mandelbrot set, they are related fractal structures arising from quadratic functions.
The video provides an in-depth comparison of the bifurcation diagrams and escape time fractals for the logistic and quadratic maps.
Transcripts
Browse More Related Video

Lyapunov's Fractal (that Lyapunov knew nothing about) #SoME2

The Feigenbaum Constant (4.669) - Numberphile

The Mandelbrot Set: Atheists’ WORST Nightmare
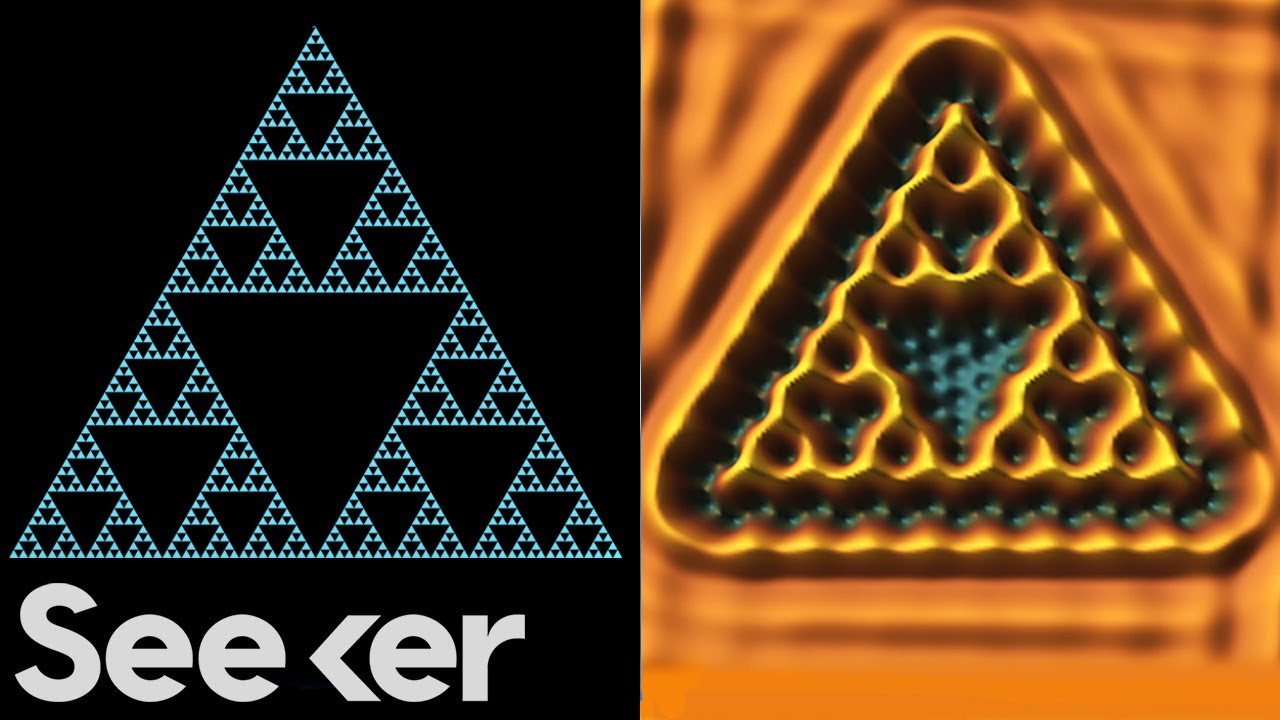
Scientists Trapped Electrons In a Quantum Fractal (And It's Wild!)

Sounds of the Mandelbrot Set
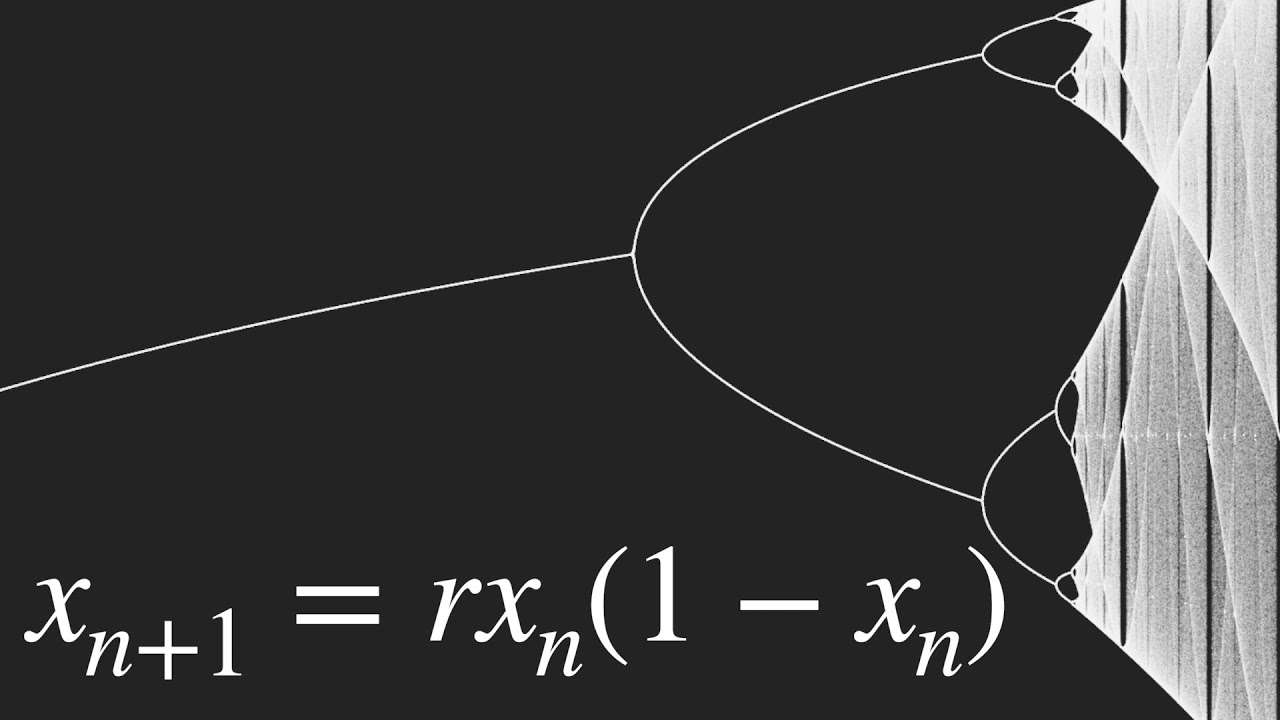
This equation will change how you see the world (the logistic map)
5.0 / 5 (0 votes)
Thanks for rating: