Lyapunov's Fractal (that Lyapunov knew nothing about) #SoME2
TLDRThe video script delves into the fascinating world of Lyapunov fractals, named after Alexander Lyapunov who laid the mathematical groundwork in his 1892 doctoral thesis. The fractals were popularized by physicist Mario Marcus in the late 1980s and are generated using a modified version of the logistic map. The video explains the concept of iterated functions or maps, showcasing how different functions can lead to various behaviors such as convergence to a point, cycling between points, or chaotic divergence. The logistic map is used to illustrate these behaviors, with the Lyapunov exponent playing a crucial role in determining the stability of the system. The script then explores the creation of the Lyapunov fractal by alternating between two values of 'r', resulting in a captivating visualization of stability and chaos. The video concludes with the exploration of the fractal's relationship with the bifurcation diagram and the potential for extending the fractal to three dimensions or using other maps for generalization.
Takeaways
- 🌀 The Lyapunov fractal is a mathematical concept that visualizes the behavior of iterated function sequences, popularized by physicist Mario Marcus in the late 1980s.
- 📊 Named after Alexander Lyapunov, who laid the mathematical groundwork in his doctoral thesis in 1892, the fractal explores stability and chaos in systems.
- ➿ The fractal is generated using a modified version of the logistic map, which involves iterating a function and observing how the sequence behaves over time.
- 🔁 The logistic map is a simple model used to describe population growth, where the sequence's behavior can converge to a point, cycle between points, or become chaotic.
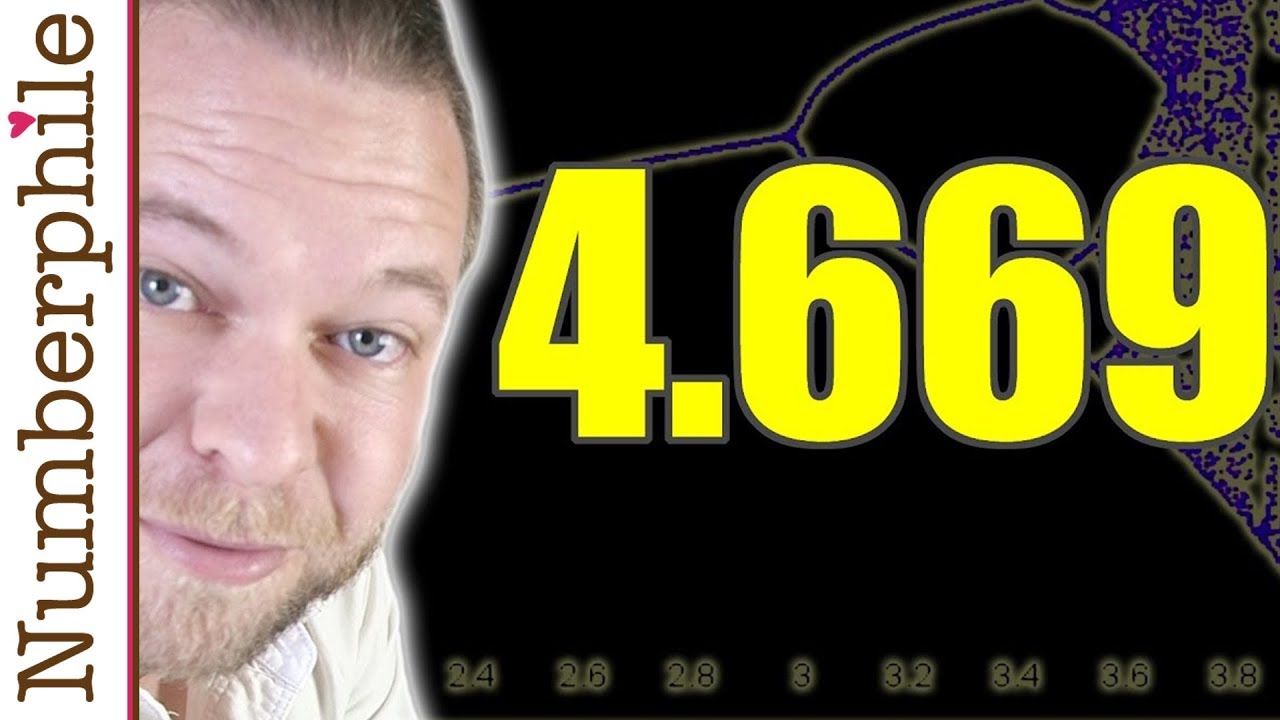
- 📈 The bifurcation diagram is a tool used to visualize the different behaviors of the logistic map as a parameter (r) changes, showing regions of stability and chaos.
- 🔢 The Lyapunov exponent (λ) is a measure of the sensitivity of a system to its initial conditions and helps determine if a system is stable or chaotic.
- 🎨 The color scheme of the Lyapunov fractal typically uses yellow for stable regions and blue for chaotic regions, with darker shades indicating more stability or chaos.
- 🔄 The sequence of 'a' and 'b' values in the modified logistic map affects how the system alternates between these values, influencing the resulting behavior and the fractal's appearance.
- 🔢 The stability or chaos of a system can depend on the starting point in the sequence of 'a' and 'b' values, leading to different Lyapunov exponents for the same (a, b) coordinate.
- 🧵 The bifurcation diagram can be extended to higher dimensions, and the Lyapunov fractal can also be represented in 3D, adding a new dimension to the analysis.
- 🌐 The concept of the Lyapunov fractal can be generalized to other maps beyond the logistic map, each with its own unique bifurcation diagram and fractal pattern.
- 🔍 High-resolution plots of the Lyapunov fractal require a trade-off between detail and computation time, as increasing resolution necessitates fewer iterations for each point.
Q & A
What is a Lyapunov fractal?
-A Lyapunov fractal is a mathematical set that was first created by physicist Mario Marcus in the late 1980s and popularized in Scientific American in 1991. It is named after Alexander Lyapunov, who laid the mathematical groundwork for it in his doctoral thesis in 1892. The fractal visualizes the behavior of iterated function sequences, particularly focusing on stability and chaos.
What is the significance of the logistic map in the context of Lyapunov fractals?
-The logistic map is a mathematical function that is used to generate the Lyapunov fractal. It is a modified version of the logistic map that is used to create the fractal by iterating through the function and observing the behavior of the sequence as parameters change.
How does the behavior of iterated sequences in the logistic map relate to stability and chaos?
-The behavior of iterated sequences in the logistic map can converge to a single point, enter a cycle between several points, blow up to infinity, or chaotically bounce between points. The Lyapunov exponent, denoted by lambda, is used to measure this behavior, with negative values indicating stability and positive values indicating chaos.
What is the role of the Lyapunov exponent in determining the stability of a system?
-The Lyapunov exponent is a measure of the sensitivity of a dynamic system to initial conditions. A negative Lyapunov exponent indicates that the system is stable and will be attracted toward a point or cycle of points. A positive Lyapunov exponent signifies that the system is chaotic and does not settle on a point or cycle.
How does the bifurcation diagram relate to the Lyapunov fractal?
-The bifurcation diagram shows the stable and chaotic regions of the logistic map as a function of the parameter 'r'. The Lyapunov fractal extends this concept by incorporating two parameters, 'a' and 'b', and a sequence 's' that determines how these parameters switch during iteration. The fractal visualizes the stability and chaos across the 'a-b' plane.
What is the significance of the color scheme used in the Lyapunov fractal?
-The color scheme in the Lyapunov fractal is used to represent the stability and chaos of the system. Yellow colors represent stable regions (with darker shades indicating more stability), while blue colors represent chaotic regions (with darker shades indicating more chaos). This visual representation helps to quickly identify regions of interest within the fractal.
How does the order of the sequence 'a' and 'b' in the modified logistic map affect the resulting fractal?
-The order of 'a' and 'b' in the sequence can change the behavior of the iterates and thus the appearance of the fractal. Different sequences can lead to different cycles or levels of chaos, resulting in different Lyapunov exponents and, consequently, different visual patterns in the fractal.
What happens when 'a' and 'b' are equal in the modified logistic map?
-When 'a' and 'b' are equal, the modified logistic map is equivalent to the original logistic map. The system behaves as if there is only one parameter, and the fractal will align with the bifurcation diagram of the logistic map along the line where 'a' equals 'b'.
How can the Lyapunov fractal be extended to three dimensions?
-The Lyapunov fractal can be extended to three dimensions by adding a new parameter to the sequence, such as 'c'. This new parameter introduces a time axis, allowing for 2D slices of the 3D fractal to be analyzed, providing additional depth to the visualization of stability and chaos.
Can other maps besides the logistic map be used to generate similar fractals?
-Yes, other maps can be used to generate similar fractals. Each map has its own bifurcation diagram and corresponding fractal. The process of generating a fractal from a map involves iterating through the function, calculating the Lyapunov exponent, and visualizing the results in a manner similar to the Lyapunov fractal.
What is the practical application of Lyapunov fractals in understanding complex systems?
-Lyapunov fractals provide a visual representation of the stability and chaotic behavior of complex systems. They can be used to predict the behavior of systems under different conditions, identify regions of stability, and understand the transition points to chaos. This can be particularly useful in fields such as physics, mathematics, and even economics where system dynamics are crucial.
Outlines
🌀 Introduction to Lyapunov Fractals
The video begins with an introduction to Lyapunov fractals, also known as Oppanav or Marcus fractals, which were first created by physicist Mario Marcus in the late 1980s and popularized in Scientific American in 1991. The fractals are named after Alexander Lyapunov, who laid the mathematical groundwork in his 1892 doctoral thesis. The video aims to explain how these fractals are generated, the meaning of their colors, and their overlapping nature. It starts with the concept of iterated functions or maps, using the logistic map as an example to demonstrate different behaviors such as convergence to a single point, cycling between points, divergence to infinity, or chaotic bouncing.
📈 Bifurcation and Lyapunov Exponent
The video then delves into the logistic map's behavior as the parameter 'r' is varied, showing how the system can transition from stable to chaotic behavior, a phenomenon known as bifurcation. A bifurcation diagram is introduced to visualize these transitions. The Lyapunov exponent, a measure of stability, is explained and demonstrated with examples. It is shown that when the Lyapunov exponent is negative, the system is stable, and when it is positive, the system is chaotic. The relationship between the bifurcation diagram and the Lyapunov exponent is highlighted.
🔄 Modified Logistic Map and Sequence Behavior
The video explains Mario Marcus's modified version of the logistic map, where the 'r' value alternates between two different values, 'a' and 'b'. This alternation can affect the behavior of the system, trapping it in cycles or leading to chaos. The concept of a sequence 's' that dictates the switching between 'a' and 'b' is introduced. The video then explores how changing the values of 'a' and 'b' or the sequence 's' can influence the system's behavior, and how the Lyapunov exponent can be calculated for any sequence generated using the modified logistic map.
🎨 Lyapunov Fractal Visualization
The process of visualizing the behavior of the system as 'a' and 'b' values are varied is described, leading to the creation of the Lyapunov fractal. The fractal is shown with a color scheme indicating stability (yellow) and chaos (blue) based on the Lyapunov exponent. The video discusses increasing the resolution of the fractal and modifying the color scheme to better represent the stability and chaos. The fractal's self-similarity and the ability to zoom into details are highlighted.
🔗 Relationship with Bifurcation Diagram and Generalization
The video concludes by discussing the relationship between the Lyapunov fractal and the bifurcation diagram, noting that the fractal can be extended to three dimensions by adding a new parameter 'c'. It is shown that the modified logistic map is equivalent to the original logistic map when 'a' equals 'b'. The video also touches on the possibility of generalizing the fractal using other maps, each with its own bifurcation diagram and fractal. The viewer is thanked for watching, and the video ends.
Mindmap
Keywords
💡Lyapunov Fractal
💡Iterated Functions
💡Logistic Map
💡Bifurcation
💡Lyapunov Exponent
💡Stability
💡Chaos Theory
💡Color Scheme
💡Sequence of 'a's and 'b's
💡Bifurcation Diagram
💡3D Fractal
Highlights
Lyapunov fractals were first created by physicist Mario Marcus in the late 1980s and popularized in Scientific American in 1991.
Fractals are named after Alexander Lyapunov, who laid the mathematical groundwork in his 1892 doctoral thesis.
Iterated functions or maps are a simple concept used to generate fractals by repeatedly applying a function to an initial value.
Different behaviors of sequences can converge to a single point, cycle between points, blow up to infinity, or chaotically bounce between points.
The logistic map is used to generate the Lyapunov fractal, which is a modified version of the map.
By changing the function (r value in logistic map), different behaviors and bifurcation patterns emerge.
Bifurcation diagrams help visualize the sequence's final values as a parameter (r) increases, showing stability and chaos.
Lyapunov exponent, denoted by lambda, is used to determine the stability of a system and is calculated using the logistic map's derivative.
A negative Lyapunov exponent indicates a stable system, while a positive exponent indicates a chaotic system.
Mario Marcus's modified logistic map alternates between two r values, a and b, to generate the fractal's sequences.
The sequence of a's and b's (s) determines how the r value switches between a and b, affecting the system's behavior.
The Lyapunov fractal is generated by plotting the stability of sequences for various pairs of a and b values.
Different color schemes can represent the stability and chaos in the fractal, with yellow for stability and blue for chaos.
The fractal can be extended to 3D by adding a new parameter (c) and viewing 2D slices of the 3D structure.
The bifurcation diagram can be extended to include the modified logistic map's two r values, adding a third dimension to the plot.
The diagonal line in the fractal where a and b are equal shows that Marcus's modified logistic map is equivalent to the original when a equals b.
The relationship between the Lyapunov fractal and the bifurcation diagram is maintained along the line where a equals b.
Other maps besides the logistic map can be used to generate different bifurcation diagrams and fractals.
Transcripts


5.0 / 5 (0 votes)
Thanks for rating: