Interpreting box plots | Data and statistics | 6th grade | Khan Academy
TLDRThe video transcript discusses the interpretation of a box and whiskers plot, which represents the ages of students at a party. The speaker presents five statements for viewers to evaluate based on the plot's data. The first statement, claiming all students are under 17, is confirmed as true since the maximum age shown is 16. The second statement, suggesting at least 75% of students are 10 or older, is also deemed likely true, as the second quartile begins at age 10. The speaker uses scenarios to illustrate how the data could support this claim. The third and fourth statements, concerning the number of seven- and sixteen-year-olds, are uncertain based on the plot; the data is insufficient to confirm or refute these specifics. Lastly, the statement that exactly half the students are older than 13 is considered possibly true or false, as different data sets could fit the plot. The video emphasizes the importance of critically analyzing statistical data and acknowledging when conclusive statements cannot be made.
Takeaways
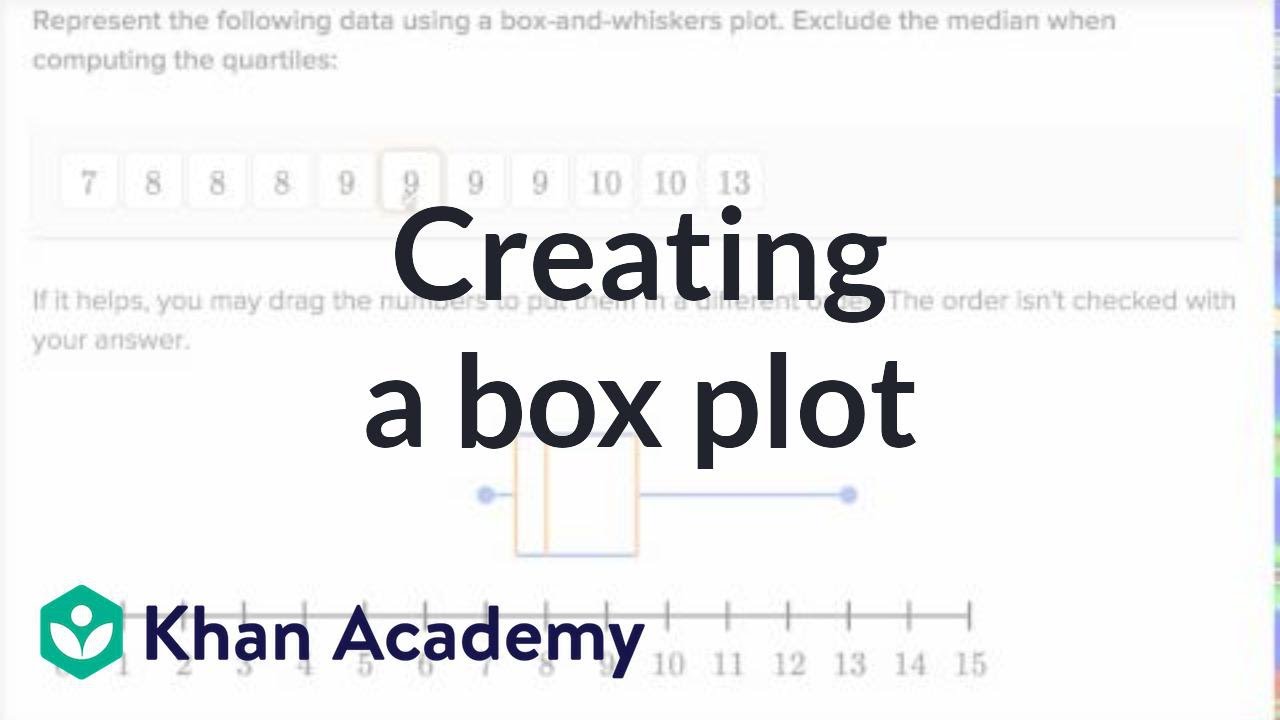
- 📈 **Understanding Box and Whiskers Plots:** The video focuses on interpreting a box and whiskers plot, which shows the distribution of ages of students at a party.
- 🔍 **Analyzing Statements:** Five different statements are presented, and the task is to determine if they are true, false, or uncertain based on the plot.
- 👍 **All Students Under 17:** The first statement that all students are less than 17 years old is confirmed as true since the maximum age shown is 16.
- 🤔 **75% of Students 10 or Older:** The second statement about at least 75% of students being 10 years old or older is suggested to be true, as 10 is the beginning of the second quartile.
- 📊 **Quartiles and Distribution:** The video explains that approximately 25% of values fall within each quartile, helping to assess the likelihood of statements.
- 🧐 **Scenario Construction:** To determine the truth of statements, scenarios with different numbers of students are constructed to fit the box plot data.
- 🔢 **Median and Quartile Values:** The median age is identified as 13, and the plot's minimum and maximum values are seven and sixteen, respectively.
- 🤷♂️ **Uncertainty in Counts:** It is acknowledged that without knowing the exact number of students, some statements remain uncertain.
- 👧 **Single Age Instances:** The statements about there being only one seven-year-old and one sixteen-year-old cannot be confirmed or denied with the given data.
- 🍂 **Multiple Possibilities:** The video illustrates that there are multiple possible datasets that could fit the box and whiskers plot, leading to uncertainty in some interpretations.
- 📉 **Half of Students Older Than 13:** The statement that exactly half the students are older than 13 is shown to be possibly true in some scenarios but not guaranteed.
- 🤓 **Importance of Caution in Statistics:** The video emphasizes the importance of careful analysis and acknowledging when data does not provide a definitive answer.
Q & A
What is the first statement analyzed in the video regarding the students' ages?
-The first statement is that all of the students are less than 17 years old. This is confirmed as true since the maximum age indicated by the right whisker of the box plot is 16.
What is the second statement about the students' ages, and is it true?
-The second statement is that at least 75% of the students are 10 years old or older. Based on the box plot, this is likely true since the second quartile begins at age 10.
How does the video demonstrate that the second statement could be true?
-The video uses scenarios with different numbers of students to show that in various configurations, at least 75% of the students could be 10 years old or older, fitting the box plot data.
What is the median age of the students according to the box plot?
-The median age of the students is 13, as indicated by the line inside the box of the box plot.
What does the video suggest about the minimum and maximum ages of the students?
-The video confirms that the minimum age is 7 and the maximum age is 16, as shown by the endpoints of the whiskers in the box plot.
What is the third statement analyzed in the video, and what is the conclusion regarding its truth?
-The third statement is that there is only one seven-year-old at the party. The video concludes that we cannot be certain about this, as the data does not specify the exact number of students at each age.
What is the fourth statement about the students' ages, and what is the conclusion about its validity?
-The fourth statement is that there is only one 16-year-old at the party. Similar to the third statement, the video concludes that this could be true in some scenarios but not in others, so we cannot be sure based on the box plot alone.
What is the fifth statement discussed in the video, and what is the analysis regarding its accuracy?
-The fifth statement is that exactly half the students are older than 13. The video demonstrates that this could be true in some data configurations but not in others, hence it's not possible to confirm its accuracy with the given box plot.
What is the main takeaway from the video regarding the interpretation of statistical data?
-The main takeaway is the importance of critically analyzing statistical data and understanding the limitations of what can be inferred. It's crucial to distinguish between statements that can be confirmed, those that can be refuted, and those where the data is inconclusive.
How does the video emphasize the importance of not making unfounded claims based on statistical data?
-The video emphasizes this by showing multiple scenarios that could fit the same box plot data, thus proving that without additional information, one cannot make certain claims about the data. It encourages the admission of 'not knowing' when the data is insufficient.
What is the significance of the quartiles in a box plot for understanding the distribution of data?
-Quartiles in a box plot divide the data into four equal parts, with each part representing 25% of the data. They help in understanding the spread of the data and identifying the median, which is the second quartile. This provides insights into the distribution without assuming a normal distribution.
How does the video use the concept of scenarios to explore the possibilities within the data presented by the box plot?
-The video constructs different scenarios with varying numbers of students and their ages to show how the same box plot could represent different distributions of ages. This demonstrates the range of possibilities that are consistent with the box plot and highlights the importance of not making definitive statements without more specific data.
Outlines
📊 Interpreting a Box and Whiskers Plot
The video begins with a voiceover discussing a box and whiskers plot representing the ages of students at a party. The goal is to practice interpreting the plot by evaluating five statements. The first statement, that all students are under 17, is confirmed as true since the maximum age shown is 16. The second statement, that at least 75% of the students are 10 or older, is also considered likely true, as the second quartile starts at 10. The speaker uses scenarios to illustrate how the data could support this statement, emphasizing the importance of understanding the distribution of data within the plot.
🤔 Assessing the Certainty of Statements
The video continues by examining the certainty of the remaining statements based on the box and whiskers plot. It is shown that it's possible to construct data sets where there's only one 7-year-old and one 16-year-old at the party, making these statements potentially true but not definitive. The statement about exactly half the students being older than 13 is also discussed, with the presenter demonstrating that this could be true in some scenarios but not in others. The video concludes by emphasizing the importance of critical thinking when interpreting statistical data, acknowledging when there is not enough information to make a definitive statement.
Mindmap
Keywords
💡Box and Whiskers Plot
💡Quartiles
💡Median
💡Interpretation
💡Data Distribution
💡Outliers
💡Minimum and Maximum
💡Statistical Scenarios
💡Percentiles
💡Data Analysis
💡Constructing Data Sets
💡Statistical Inference
Highlights
A box and whiskers plot is used to show the ages of students at a party.
The video aims to practice interpreting a box and whiskers plot with five different statements.
All students are less than 17 years old, as the maximum age shown is 16.
At least 75% of the students are 10 years old or older, based on the second quartile starting at 10.
The median age is 13, which is the dividing point between the second and third quartiles.
Different data sets can be constructed to fit the same box and whiskers plot.
A scenario with an odd number of students places the median age (13) in the middle.
The minimum age is seven and the maximum is 16, as indicated by the plot.
It's possible to have multiple seven-year-olds or sixteen-year-olds, or just one of each.
The statement about exactly half the students being older than 13 cannot be confirmed as true or false with the given data.
The importance of critically analyzing statistical data and acknowledging when information is insufficient is emphasized.
The video demonstrates the construction of different data scenarios that could align with the same box and whiskers plot.
The concept of quartiles is explained, with approximately 25% of values falling within each quartile.
The video illustrates how to determine if a statement is definitely true, false, or uncertain based on a box and whiskers plot.
The use of median to understand the distribution of ages among students is explained through examples.
The video provides a practical exercise in statistical literacy by analyzing hypothetical party attendee ages.
The limitations of a box and whiskers plot in providing exact numbers of individuals within certain age groups are discussed.
The necessity to consider various possible data distributions when interpreting statistical plots is highlighted.
Transcripts
Browse More Related Video
Box and whisker plot exercise example | Data and statistics | 6th grade | Khan Academy

True or False Quiz - Music Theory
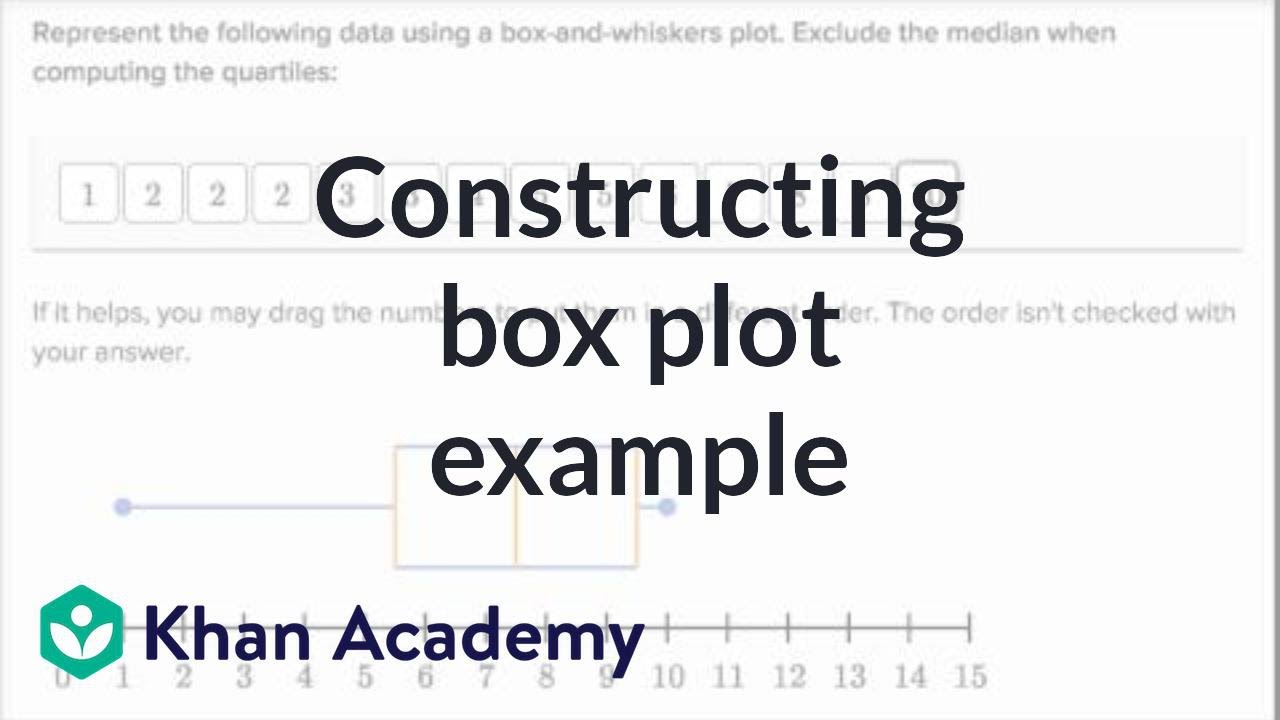
Another example constructing box plot | Data and statistics | 6th grade | Khan Academy
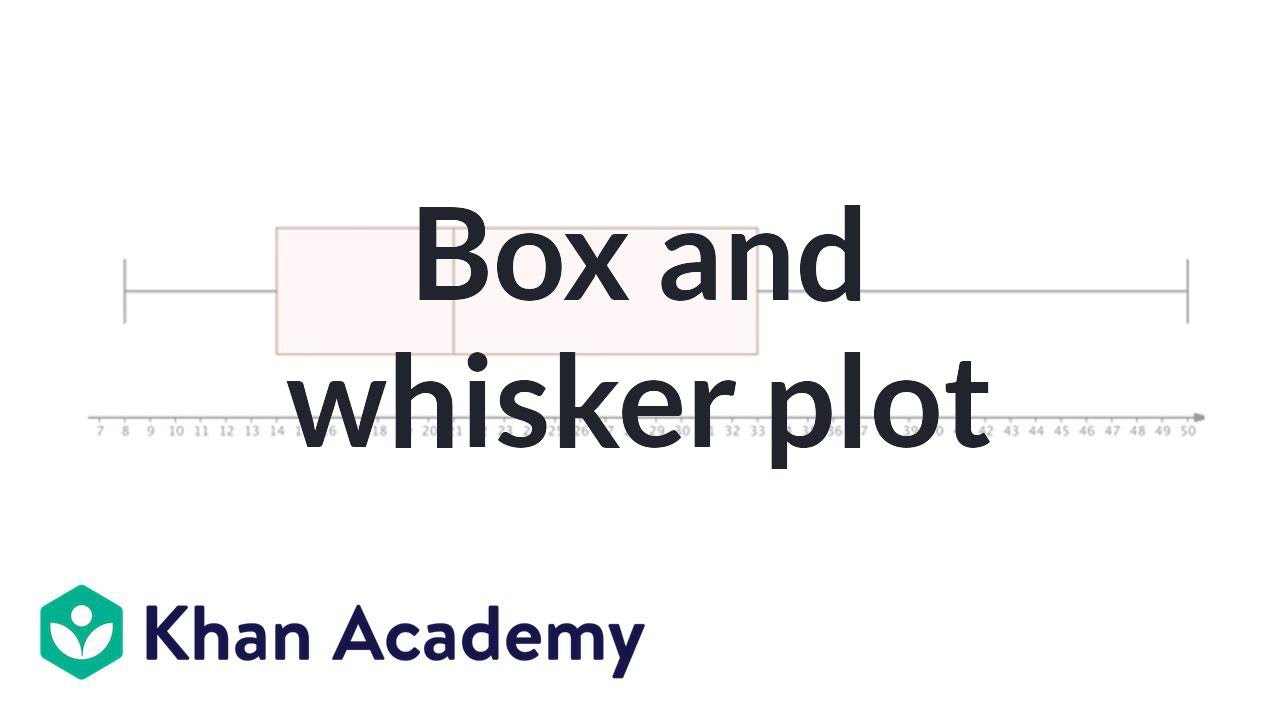
Box and whisker plot | Descriptive statistics | Probability and Statistics | Khan Academy
The paradox at the heart of mathematics: Gödel's Incompleteness Theorem - Marcus du Sautoy
AP Physics B Kinematics Presentation #70
5.0 / 5 (0 votes)
Thanks for rating: