AP Calculus AB - 6.2 Approximating Areas with Riemann Sums
TLDRIn this comprehensive overview of Riemann Sums, Mr. Bortnick guides students through the process of approximating areas under curves using different methods. The video begins by introducing the concept of Riemann Sums as a means to estimate areas under irregular curves. It then delves into various techniques, including left, right, and midpoint Riemann sums, as well as the trapezoidal rule. Each method is explained with visual aids and step-by-step calculations, emphasizing how the number of rectangles or the positioning of points affects the accuracy of the approximation. The video also addresses how to determine whether an approximation is an overestimate or an underestimate by considering the function's concavity and monotonicity. Towards the end, Mr. Bortnick demonstrates how to apply these concepts using a table of values instead of a function, which is particularly useful for AP exam-style questions. The video concludes with a reminder of the importance of practice and offers support for any further questions, encouraging students to engage with the material and seek help when needed.
Takeaways
- 📐 **Riemann Sums Overview**: Riemann sums are used to approximate the area under a curve when exact geometric shapes cannot be used.
- 📉 **Left Rectangular Approximation**: In this method, rectangles are placed under the curve, touching the curve at the left side, which can underestimate the area.
- 📈 **Right Rectangular Approximation**: Similar to the left method, but rectangles touch the curve at the right side, often resulting in an overestimate of the area.
- 🔴 **Increasing vs Decreasing Functions**: The type of Riemann sum approximation (under or over) depends on whether the function is increasing or decreasing.
- 🔵 **Midpoint Riemann Sum**: This method uses the midpoint of each subinterval to determine the height of the rectangle, which can provide a better approximation than left or right sums.
- 📊 **Trapezoidal Rule**: By connecting the left and right endpoints of each subinterval, trapezoids are formed, which generally offer a more accurate approximation than rectangular sums.
- 🔢 **Width Calculation**: For all Riemann sum methods, the width of each rectangle or trapezoid is calculated as (b - a) / n, where 'a' and 'b' are the interval endpoints and 'n' is the number of subintervals.
- 📋 **Table Integration**: Riemann sums can be applied to a table of values without a graph or explicit function, using the given data points to estimate areas.
- 🔼 **Increasing Function Impact**: For an increasing function, the left Riemann sum typically underestimates while the right Riemann sum overestimates the area under the curve.
- 🔽 **Decreasing Function Impact**: For a decreasing function, the left Riemann sum overestimates and the right Riemann sum underestimates the area.
- 🏁 **Concavity Consideration**: When using trapezoidal approximations, the concavity of the function (whether it curves upward or downward) affects whether the estimate is an over or undervalue.
- 📘 **Practice and Application**: The script encourages practice with different types of Riemann sums and to apply these methods to various problems, including those presented in a tabular format.
Q & A
What is the main topic of the video?
-The main topic of the video is approximating areas under curves using Riemann sums, specifically focusing on different methods such as left, right, midpoint Riemann sums, and the trapezoidal rule.
What is a Riemann sum?
-A Riemann sum is a method to estimate the area under a curve when exact calculation is not possible by using a series of rectangles to approximate the area.
How does the left rectangular approximation method work?
-In the left rectangular approximation method, rectangles are drawn under the curve with their left sides touching the curve, providing an estimate of the area under the curve.
What is the formula for calculating the width of a rectangle in a Riemann sum?
-The formula for calculating the width of a rectangle in a Riemann sum is (b - a) / n, where 'a' and 'b' are the endpoints of the interval and 'n' is the number of rectangles used.
How does increasing the number of rectangles (n) affect the estimate of the area under the curve?
-Increasing the number of rectangles (n) generally leads to a better approximation of the area under the curve, as it reduces the amount of area that is missed or 'wasted' in the estimate.
What is the difference between a left Riemann sum and a right Riemann sum?
-The difference between a left and right Riemann sum lies in which side of the rectangle touches the curve. In a left Riemann sum, the left side of the rectangle touches the curve, while in a right Riemann sum, the right side of the rectangle touches the curve.
What is the midpoint Riemann sum?
-The midpoint Riemann sum is a method where the height of each rectangle is determined by the value of the function at the midpoint of the interval for that rectangle, rather than at the endpoints.
How does the trapezoidal rule provide an estimate of the area under a curve?
-The trapezoidal rule provides an estimate by connecting the left and right endpoints of each interval to form trapezoids, rather than rectangles, which tends to give a more accurate area estimate than the rectangular methods.
Why is the trapezoidal rule considered more accurate than the rectangular methods?
-The trapezoidal rule is considered more accurate because it accounts for the curvature of the function within each interval by averaging the function values at the endpoints, which tends to provide a better fit to the actual curve.
How can you determine if a Riemann sum is an overestimate or an underestimate of the actual area under the curve?
-To determine if a Riemann sum is an overestimate or an underestimate, one must consider whether the function is increasing or decreasing on the interval. For increasing functions, left Riemann sums are underestimates and right Riemann sums are overestimates. For decreasing functions, the opposite is true.
What is the significance of the trapezoidal sum being halfway between the left and right Riemann sums in the given example?
-The significance is that it shows the trapezoidal sum provides a more balanced estimate, taking into account both the overestimation of the right Riemann sum and the underestimation of the left Riemann sum, which can be useful for understanding the accuracy of different approximation methods.
Outlines
📚 Introduction to Riemann Sums for Area Approximation
This paragraph introduces the concept of Riemann sums as a method for approximating the area under a curve when exact geometric shapes do not fit. Mr. Bortnick discusses the transition from using simple geometric shapes to Riemann sums for more complex curves. The left rectangular approximation method is explained, where rectangles are placed under the curve with their left sides touching the curve to estimate the area. The importance of increasing the number of rectangles (n) for a better approximation is emphasized.
📏 Left and Right Riemann Sums: A Deeper Dive
The second paragraph delves deeper into the left and right Riemann sums, explaining the difference between them based on which side of the rectangle touches the curve. The concept of increasing the number of rectangles for a better estimate is reiterated. The paragraph also introduces the formula for the width of a rectangle in the Riemann sum method and discusses the trade-off between approximation accuracy and the number of rectangles used.
🔍 Applying Riemann Sums to a Given Function
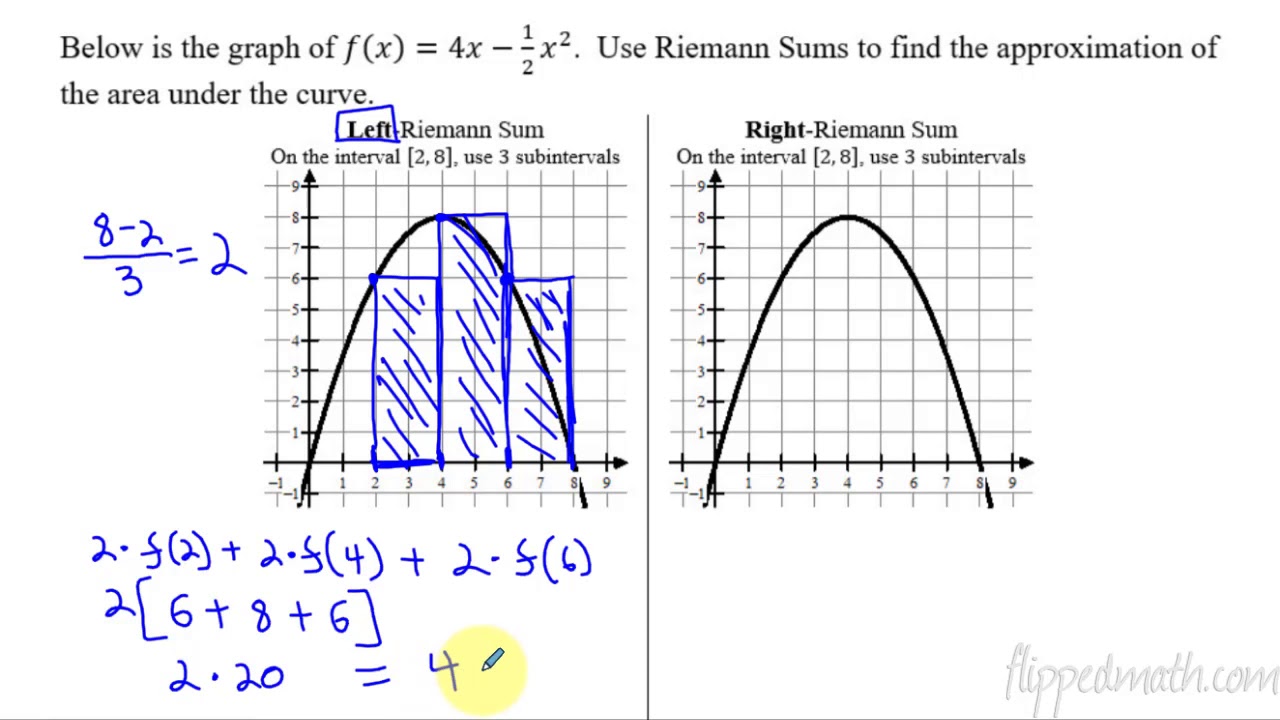
In this part, the application of Riemann sums is demonstrated through a specific function, f(x) = 4x - (1/2)x^2. The process of finding the area under the curve using left and right Riemann sums with three sub-intervals is detailed. The calculation involves determining the height of each rectangle based on the function's value at certain points and then multiplying by the width of the rectangles to approximate the area.
🔢 Estimation of Area Under a Curve Using Different Riemann Sums
The fourth paragraph discusses the results of using left, right, and midpoint Riemann sums to estimate the area under the same curve, yielding different values (40, 28, and 37 units squared, respectively). This illustrates the variation in estimates based on the method used. The paragraph also touches on the concepts of overestimation and underestimation in the context of increasing and decreasing functions.
📐 Midpoint and Trapezoidal Riemann Sums Explained
This section introduces the midpoint Riemann sum and the trapezoidal sum as alternative methods for estimating the area under a curve. The midpoint sum uses the height at the midpoint of each sub-interval, while the trapezoidal sum connects the left and right sides of the curve to form trapezoids. The paragraph explains that the trapezoidal sum is generally the most accurate method among those discussed when using the same number of intervals.
📉 Function Concavity and Riemann Sum Estimation
The sixth paragraph discusses how the concavity of a function affects the accuracy of Riemann sum estimations. It explains that for concave-up functions, trapezoidal estimations tend to overestimate the area, while for concave-down functions, they tend to underestimate. The importance of identifying whether a function is increasing or decreasing, or concave up or down, is stressed for accurate estimation.
🚰 AP Exam Style Question: Riemann Sums with Tabular Data
The seventh paragraph presents a style of question often found on AP exams, where a table of values is provided instead of a graph or equation. The scenario involves estimating the volume of water pumped into a tank over 12 minutes using different Riemann sums. The paragraph demonstrates how to calculate the right Riemann sum with four sub-intervals using the provided data, resulting in an estimate of 273 gallons.
📈 Left Riemann Sums and Function Increase
The eighth paragraph continues the AP exam-style question, this time calculating the left Riemann sum with four sub-intervals. It explains that since the function is increasing, the left Riemann sum will underestimate the area, resulting in an estimate of 183 gallons. The difference between the left and right Riemann sum estimates is highlighted, with the trapezoidal sum expected to fall between them.
📊 Midpoint, Trapezoidal Sums, and Final Estimations
The final paragraph covers the midpoint Riemann sum with two sub-intervals and the trapezoidal sum with four sub-intervals using the table provided. It demonstrates a factoring method to simplify the calculation of the trapezoidal sum, which is expected to yield a value between the left and right Riemann sum estimates. The paragraph concludes with an encouragement to practice different types of Riemann sums and to seek clarification on any doubts.
Mindmap
Keywords
💡Riemann Sum
💡Left Rectangular Approximation
💡Right Rectangular Approximation
💡Midpoint Riemann Sum
💡Trapezoidal Rule
💡Concavity
💡Increasing Function
💡Decreasing Function
💡Subinterval
💡Estimation
💡AP Exam
Highlights
Introduction to approximating areas under curves that are not geometrically simple using Riemann sums.
Explanation of the left rectangular approximation method for estimating areas under a curve.
Demonstration of how increasing the number of rectangles (n) in a Riemann sum improves the area estimate.
The concept that Riemann sums are always an approximation and never exact due to the horizontal lines of the rectangles.
Use of the formula (b - a) / n for calculating the width of a rectangle in a Riemann sum method.
Illustration of the process to calculate the area under the curve of the function f(x) = 4x - 1/2x^2 using Riemann sums.
Comparison between left Riemann sums, right Riemann sums, and how they can overestimate or underestimate the area under a curve.
Introduction to the midpoint Riemann sum, which uses the midpoint of each interval to estimate the height of the rectangles.
Explanation of the trapezoidal sum, which is considered the most accurate method for estimating the area under a curve with a given number of intervals.
Discussion on how the shape of the curve (concave up or down) affects whether the trapezoidal rule overestimates or underestimates the area.
Application of Riemann sums using a table of values instead of a function or graph, commonly found in AP exam-style questions.
Method to estimate the number of gallons of water pumped into a tank over 12 minutes using Riemann sums with given intervals.
Determination of whether Riemann sums are overestimates or underestimates based on the function's increase or decrease.
Use of the factoring method to simplify the calculation of the trapezoidal sum using a table of values.
Final estimates of water pumped into the tank using different Riemann sums and the implications of these estimates.
Advice on practicing different types of Riemann sums and checking answers against posted solutions.
Encouragement for students to attend office hours with any questions and well wishes for their mastery check.
Transcripts
Browse More Related Video
Calculus AB/BC – 6.2 Approximating Areas with Riemann Sums

Calculus AB Homework 6.2 Riemann and Trapezoidal Sums

AP Calculus AB: Lesson 6.2 Riemann and Trapezoidal Sums

Riemann and Trapezoidal Sums from Tables of Values
Calculus 1: Definition of the Integral Examples
Worked example: over- and under-estimation of Riemann sums | AP Calculus AB | Khan Academy
5.0 / 5 (0 votes)
Thanks for rating: