Ch. 3.2 Polynomial Functions and their Graphs
TLDRThis educational video script introduces the concept of polynomial functions and their graphs, focusing on how to manually graph polynomial functions. It covers key topics such as the definition of polynomial functions, the significance of coefficients, degree, and the end behavior of polynomials. The script also discusses the importance of zeros and their multiplicity in shaping the graph, the concept of local extrema, and provides a step-by-step example of graphing a sixth-degree polynomial by hand, emphasizing the insights gained from understanding polynomials that can be applied in advanced mathematics.
Takeaways
- 📚 The lesson introduces polynomial functions and their graphs, focusing on how to graph them by hand, a skill that will be further developed in calculus courses.
- 🔍 The script explains the concept of polynomial functions with the general form and the significance of coefficients, leading terms, and the degree of the polynomial.
- 📈 The degree of a polynomial is crucial as it determines the general shape of the graph and the maximum possible number of zeros (x-intercepts).
- 📉 The sign of the leading coefficient influences the end behavior of the graph, affecting whether the graph tends towards positive or negative infinity at the extremes.
- 📊 Odd and even degree polynomials exhibit different end behaviors: odd degrees resemble a straight line with squiggles, while even degrees have a U-shape with squiggles.
- 🔑 The zeros of a polynomial, their multiplicity, and whether they cross or bounce off the x-axis are vital for understanding the graph's interior.
- 📐 The concept of local extrema is introduced, stating that a polynomial of degree n can have at most n-1 local maxima or minima.
- 📘 The importance of graphing polynomials without a calculator is emphasized for a deeper understanding of their behavior and for analytical purposes in higher mathematics.
- 📑 The script provides a step-by-step example of graphing a polynomial by hand, starting with identifying the degree, end behavior, y-intercept, and zeros.
- 📝 Evaluating the polynomial at specific points between zeros helps to refine the graph and understand the function's behavior in the middle of its domain.
- 📌 The final graphed polynomial is compared with an actual graph to demonstrate the effectiveness of the manual graphing method taught in the script.
Q & A
What is the main topic of the lecture?
-The main topic of the lecture is polynomial functions and how to graph them by hand, including analyzing their graphs and understanding their properties.
Why is graphing polynomial functions by hand important?
-Graphing polynomial functions by hand is important because it helps in understanding the behavior of polynomials, which is a fundamental skill that is further developed in calculus courses.
What is a polynomial function in the context of this lecture?
-A polynomial function, denoted as p(x), is a function of the form where each term is a product of a coefficient and a power of x, starting from the highest power down to zero.
What is the degree of a polynomial function?
-The degree of a polynomial function is the highest power of x present in the function, which determines the general shape of the graph.
What is the significance of the leading coefficient in a polynomial function?
-The leading coefficient is the coefficient attached to the highest power of x and determines the end behavior of the polynomial graph, as well as whether the graph opens upwards or downwards.
How does the degree of a polynomial affect the maximum number of zeros it can have?
-The degree of a polynomial matches the maximum possible number of zeros it can have. For example, a polynomial of degree n can have at most n zeros.
What is the difference between the end behavior of odd and even degree polynomials?
-Odd degree polynomials tend to increase or decrease without bound as x goes to positive or negative infinity, respectively, resembling a straight line with squiggles. Even degree polynomials tend to have a U-shape, with outputs going to positive infinity in both directions.
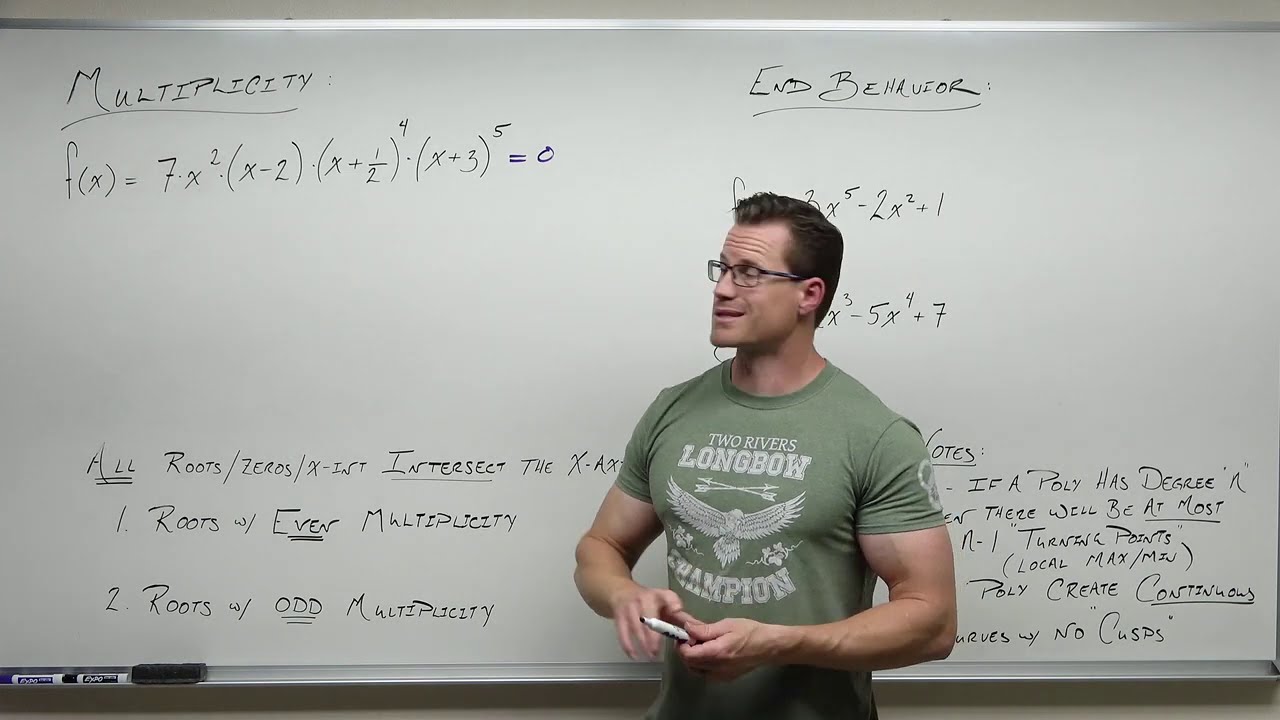
What is the significance of the multiplicity of a zero in graphing polynomials?
-The multiplicity of a zero indicates how many times the zero occurs and affects whether the graph crosses or bounces off the x-axis at that point. An odd multiplicity results in a crossing, while an even multiplicity results in a bounce.
How can you determine the y-intercept of a polynomial graph?
-The y-intercept is determined by evaluating the polynomial when x equals zero. It gives the point where the graph intersects the y-axis.
What is the relationship between the local extrema of a polynomial and its degree?
-A polynomial of degree n has at most n-1 local extrema (local maximums or minimums). These occur where the graph changes direction.
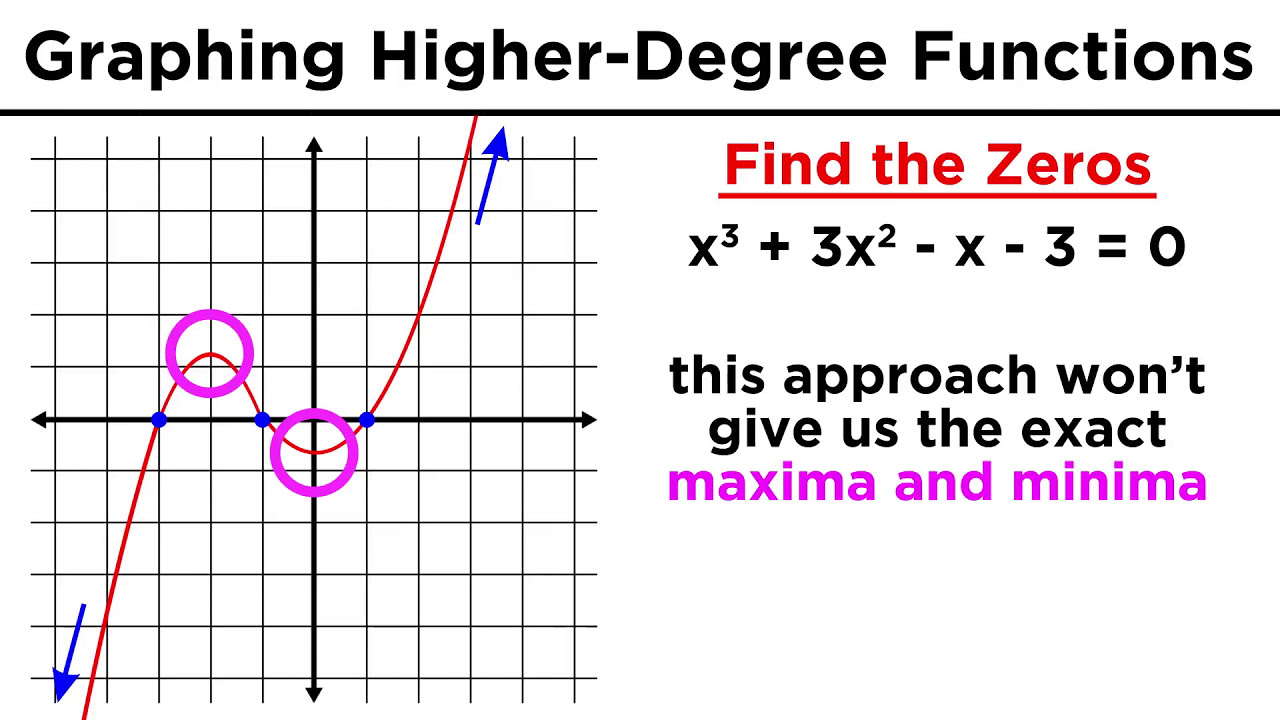
How can you approximate the graph of a polynomial function by hand?
-You can approximate the graph of a polynomial function by hand by determining the degree to understand the general shape, analyzing the end behavior based on the leading coefficient, finding the zeros and their multiplicities, calculating the y-intercept, and optionally evaluating the polynomial at a few x-values between the zeros to fill in the details.
Outlines
📚 Introduction to Polynomial Functions and Graphing
The script begins with an introduction to polynomial functions and their graphs, setting the stage for a detailed exploration of how to manually graph these functions. The instructor emphasizes the relevance of this skill in a calculus course, where more advanced techniques for graph analysis will be introduced. The session also mentions the introduction of calculus notation to facilitate the discussion on functions and other mathematical concepts throughout the course. A polynomial function is defined as an expression of the form p(x) = a_nx^n + ... + a_1x + a_0, highlighting the role of coefficients and the significance of the degree of the polynomial, which dictates the general shape of the graph.
📈 Understanding Polynomial Graphs and End Behavior
This paragraph delves into the characteristics of polynomial graphs, focusing on the degree of the polynomial and its impact on the graph's shape. It explains how the degree correlates with the maximum number of x-intercepts (zeros) a polynomial can have. The instructor also discusses the distinction between odd and even degree polynomials, noting that odd-degree polynomials tend to have a linear-like shape with 'squiggles', while even-degree polynomials resemble a 'U' shape. The concept of end behavior is introduced, describing how the graph of a polynomial behaves as x approaches positive or negative infinity, which is determined by the sign of the leading coefficient and the degree of the polynomial.
🔍 End Behavior and Polynomial Characteristics
The script continues with a deeper look at the end behavior of polynomial functions, using mathematical notation to describe the limits of these functions as x approaches positive or negative infinity. It reiterates the patterns observed in odd and even degree polynomials, emphasizing how the sign of the leading coefficient influences whether the graph opens upwards or downwards. The explanation includes a brief discussion on the implications of the leading coefficient being positive or negative on the direction in which the graph's ends point.
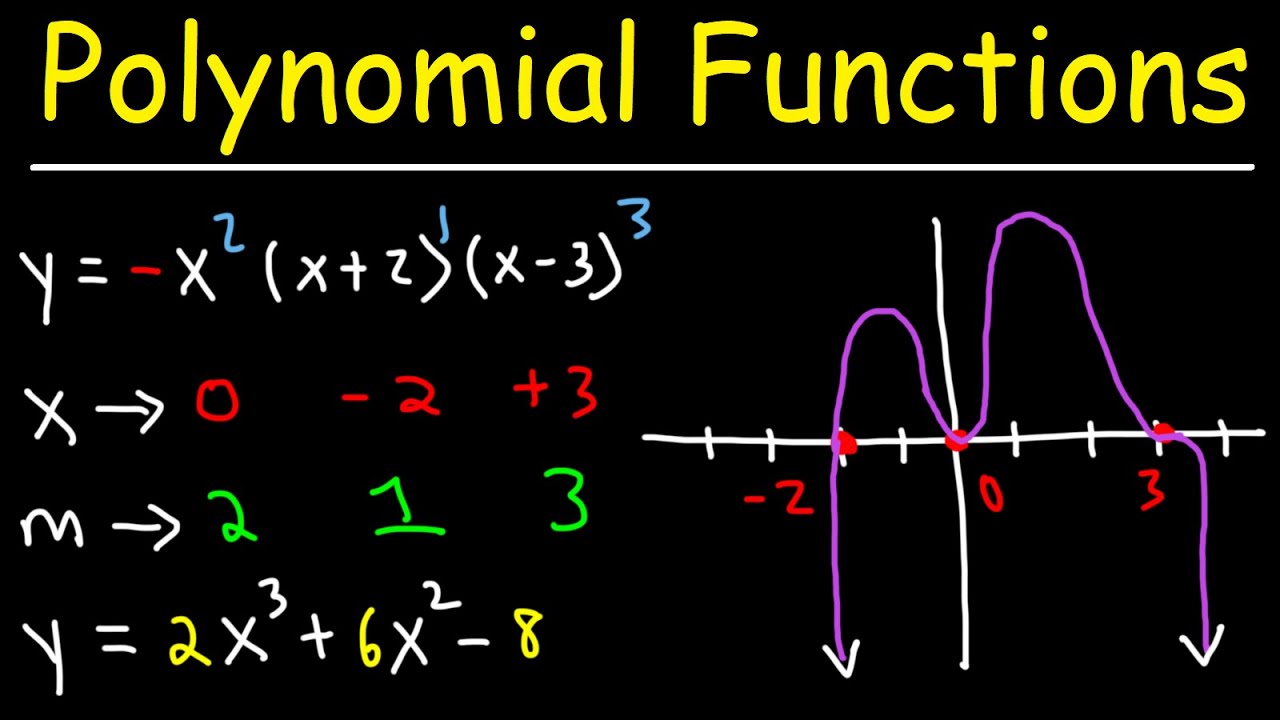
📉 Zeros of Polynomials and Their Multiplicity
The importance of zeros in polynomial functions is highlighted in this section, explaining how they help shape the interior of the graph. The concept of multiplicity is introduced, which refers to the number of times a zero occurs in a polynomial. The instructor clarifies that an odd multiplicity results in the graph crossing the x-axis, while an even multiplicity causes the graph to 'bounce off' the axis. The summary also touches on the implications of the leading coefficient's sign on the end behavior of the graph.
📚 Graphing Polynomials by Hand and Local Extrema
The script provides a step-by-step approach to graphing polynomials by hand, starting with understanding the degree of the polynomial and its general shape. It discusses the significance of the leading coefficient in determining the end behavior and the role of zeros in plotting the graph's interior. The concept of local extrema is introduced, explaining that a polynomial of degree n can have at most n-1 local maxima or minima. The instructor uses a visual graph to illustrate these points and emphasizes the importance of graphing polynomials by hand to develop a deeper understanding of their behavior.
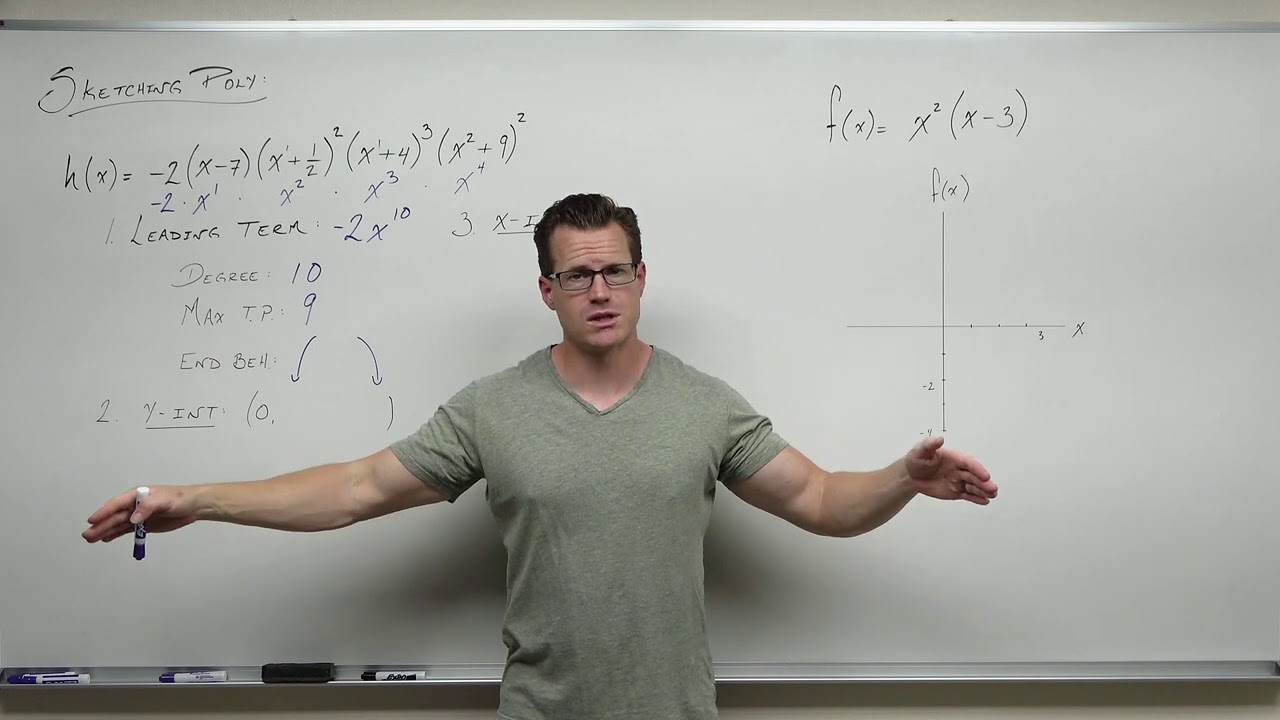
🔍 Detailed Graphing Process and Polynomial Analysis
This paragraph outlines the detailed process of graphing a specific polynomial function by hand, emphasizing the importance of understanding the degree, end behavior, y-intercept, and zeros of the function. The instructor demonstrates how to calculate the y-intercept and how to determine where the graph crosses or bounces off the x-axis based on the multiplicity of the zeros. The summary includes a rough sketch of the graph based on the information gathered and suggests evaluating the polynomial at interim points for a more accurate representation.
📈 Final Graph Comparison and Accuracy Enhancement
The final paragraph compares the rough graph sketched by the instructor with the actual graph of the polynomial function, noting the close resemblance and the effectiveness of the manual graphing method. It suggests plugging in values at interim points between known zeros to refine the graph's accuracy, providing examples of such points. The instructor emphasizes the educational value of graphing polynomials by hand, even with the availability of calculators, for a better understanding of polynomial behavior.
Mindmap
Keywords
💡Polynomial Functions
💡Graphing Polynomials
💡Degree of a Polynomial
💡Lead Coefficient
💡Zeros of a Polynomial
💡End Behavior
💡Y-Intercept
💡Local Extrema
💡Multiplicity
💡Graphing by Hand
Highlights
Introduction to polynomial functions and their graphs, focusing on graphing by hand with existing information.
Polynomial functions are defined with the form and significance of coefficients and degrees.
The importance of the degree of a polynomial in determining the general shape of its graph.
The role of the lead coefficient in influencing the end behavior of polynomial graphs.
Understanding the relationship between the degree of a polynomial and its maximum possible number of zeros.
The distinction between the end behavior of odd and even degree polynomials.
The concept of multiplicity of zeros and its impact on the graph's intersection with the x-axis.
The maximum number of local extrema a polynomial can have, related to its degree.
The process of graphing a polynomial function by hand, including estimating and plotting points.
Evaluating polynomials at specific points to refine the graph's accuracy.
The significance of the y-intercept in graphing polynomial functions.
The practical application of polynomial graphing in calculus and higher mathematics.
The comparison between the estimated graph and the actual graph for accuracy assessment.
The use of factored form for polynomials to simplify the graphing process.
The impact of the lead coefficient's sign on the polynomial's end behavior.
The detailed steps involved in manually graphing a sixth-degree polynomial as an example.
The importance of understanding polynomial functions for mathematical analysis beyond graphing.
The transition from basic polynomial graphing to more advanced techniques in calculus courses.
Transcripts
Browse More Related Video
How to Sketch Polynomial Functions (Precalculus - College Algebra 31)
How To Graph Polynomial Functions Using End Behavior, Multiplicity & Zeros
Multiplicity and End Behavior of Polynomials (Precalculus - College Algebra 29)
Graphing Higher-Degree Polynomials: The Leading Coefficient Test and Finding Zeros

Taylor Polynomials Day 1
Creating Polynomials from Real Zeros (Precalculus - College Algebra 30)
5.0 / 5 (0 votes)
Thanks for rating: