Econometrics // Lecture 2: "Simple Linear Regression" (SLR)
TLDRThis video delves into the fundamentals of econometric analysis, focusing on simple linear regression. It distinguishes between population and sample regressions, explains the interpretation of the model coefficients, and the prerequisites for assuming causality. The concept of residuals is introduced, and the derivation of coefficients through ordinary least squares (OLS) estimation is briefly explained. The video aims to enhance understanding of the linear regression model, its interpretation, and the conditions necessary for causal inferences.
Takeaways
- 📚 Introduction to simple linear regression and its components.
- 🔍 Explanation of the population regression function (PRF) and its role in modeling the true relationship between variables.
- 📈 Discussion on the differences between population and sample regressions, including the use of hats to denote estimated values.
- 🎯 Clarification on the interpretation of the coefficients, particularly the meaning of beta0 and beta1 in the context of the model.
- 🤔 Importance of understanding the limitations of causality in regression analysis, including the conditional mean independence assumption.
- 🧠 Explanation of how omitted variables can affect the accuracy of the coefficients and the potential for over- or underestimation.
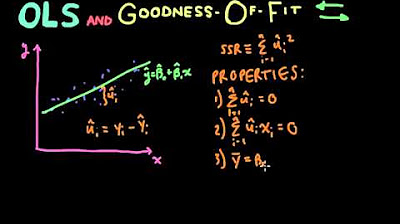
- 📊 Visual representation of the regression line, observed points, estimated points, and residuals to illustrate the regression process.
- 🔧 Derivation of the ordinary least squares (OLS) estimates, including the formula for calculating beta1 and beta0.
- 📐 Explanation of the sum of squared residuals (SSR) and its significance in evaluating the fit of the regression line.
- 🔄 Process of minimizing the SSR to obtain the best estimate for the regression coefficients.
- 🚀 Anticipation for the next video and an invitation for viewers to engage with the content through likes, comments, and subscriptions.
Q & A
What is the main topic of the video?
-The main topic of the video is econometric analysis, specifically focusing on simple linear regression.
What is the population regression function (PRF) and how is it denoted?
-The population regression function (PRF) is the true model that represents the relationship between the dependent variable (Y) and the independent variable (X) in a functional form. It is denoted as Y = beta0 + beta1X + u, where beta0 is the intercept, beta1 is the slope, and u is the error term or disturbance.
What are the differences between population and sample regressions?
-Population regression refers to the true model that represents the relationship between variables in the entire population, which is never fully known. Sample regression, on the other hand, is an estimation based on a subset of the population. In sample regression, coefficients are denoted with hats (e.g., beta0 hat, beta1 hat) and residuals are used instead of the error term.
How is the dependent variable (Y) referred to in different contexts?
-In different contexts, the dependent variable (Y) can also be referred to as the explained, response, or endogenous variable.
What does the derivative of Y with respect to X represent in a simple linear regression model?
-The derivative of Y with respect to X represents the slope of the regression line, which is the coefficient beta1. It indicates the change in Y for a one-unit change in X, assuming a causal relationship.
What is the conditional mean independence assumption in the context of causality?
-The conditional mean independence assumption, also known as the exclusion restriction, states that the derivative of the error term (u) with respect to the independent variable (X) is zero. In other words, it means that the error term is not dependent on X, which is necessary to assume causality.
Why might the coefficients beta0 and beta1 not be completely correct in a regression model?
-The coefficients beta0 and beta1 might not be completely correct if there are omitted variables that are correlated with the included independent variables. These omitted variables can lead to biased estimates, causing the coefficients to be overestimated or underestimated.
How is the ordinary least squares (OLS) estimate of beta1 derived?
-In OLS, the estimate of beta1 is derived by minimizing the sum of squared residuals. The resulting formula for beta1 hat is the covariance of X and Y divided by the variance of X.
What is the formula for calculating residuals in a regression model?
-The formula for calculating residuals (ui hat) is the difference between the observed value of Y (yi) and the estimated value (yi hat), which is given by ui hat = yi - yi hat.
How can the beta0 hat coefficient be obtained in a regression model?
-Once beta1 hat is obtained, beta0 hat can be calculated by subtracting the product of beta1 hat and the mean of X from the mean value of Y.
What is the significance of the sum of squared residuals (SSR) in a regression model?
-The sum of squared residuals (SSR) is a measure of the total deviation of the estimated regression line from the actual data points. Minimizing this value helps in finding the best fit line in the regression model, which is the goal of OLS estimation.
Outlines
📘 Introduction to Simple Linear Regression
This paragraph introduces the concept of simple linear regression, highlighting the difference between population and sample regressions. It emphasizes the importance of understanding the model's interpretation and the conditions required to assume causality. The population regression function (PRF) is introduced as the true model that we attempt to estimate using our sample data. Terminology such as dependent variable (Y), independent variable (X), and error term (u) is explained, setting the foundation for further discussion on the interpretation of coefficients and the concept of residuals.
🔍 Interpretation of Regression Coefficients and Causality
In this paragraph, the interpretation of regression coefficients, specifically beta0 and beta1, is discussed in-depth. The relationship between the independent variable (X) and the dependent variable (Y) is explored, with a focus on the derivative of Y with respect to X, which yields beta1. The conditional mean independence assumption is introduced, explaining that the error term (u) should not be dependent on X for a causal relationship to be assumed. The impact of omitted variables, such as ability, on the accuracy of beta coefficients is also discussed, emphasizing the limitations of assuming causality without considering all relevant factors.
📊 Visual Representation and Estimation of Residuals
This paragraph delves into the visual representation of the regression model, using a scatter plot of data points and a fitted line to illustrate the relationship between the independent variable (X) and the dependent variable (Y). The estimated regression line is described, with beta0 representing the intercept and beta1 representing the slope. The concept of residuals (UI hat) is introduced as the difference between the observed value (Yi) and the estimated value (Yi hat). A formula for calculating residuals is provided, and the process of minimizing the sum of squared residuals to obtain the best fit line is explained. The ordinary least squares (OLS) estimates for beta0 and beta1 are discussed, with a focus on how these estimates are derived from the data.
🎯 Summary of Simple Linear Regression and Future Content
The final paragraph summarizes the key points discussed in the video script, reinforcing the understanding of simple linear regression, the interpretation of regression coefficients, and the conditions necessary to assume causality. It reiterates the difference between population and sample regression, and the importance of accurately estimating the model's coefficients. The video script concludes with a preview of upcoming content, encouraging viewers to subscribe, like, and comment with questions for further clarification and engagement.
Mindmap
Keywords
💡Econometric Analysis
💡Simple Linear Regression
💡Population and Sample Regressions
💡Coefficients
💡Causality
💡Residuals
💡Ordinary Least Squares (OLS)
💡Conditional Mean Independence
💡Omitted Variable Bias
💡Derivative
💡Regression Line
Highlights
Introduction to econometric analysis and simple linear regression
Differences between population and sample regressions
Interpretation of the simple linear regression model
Assumptions required to infer causality from the model
Derivation of coefficients in simple linear regression
Explanation of the population regression function (PRF)
Terminology for dependent, independent, and error terms
Example of wage determination by education and the role of beta coefficients
Derivative of Y with respect to X to obtain beta 1
Conditional mean independence assumption for causality
Challenges with omitted variables and their impact on beta coefficients
Visual representation of the regression line and data points
Explanation of residuals and their calculation
Formula for ordinary least squares (OLS) estimates
Method to estimate beta0 and beta1 using OLS
Importance of understanding the model and causality assumptions
Transcripts
Browse More Related Video

Ordinary Least Squares Regression
Econometrics // Lecture 3: OLS and Goodness-Of-Fit (R-Squared)

Introduction To Ordinary Least Squares With Examples
Simple Linear Regression in R | R Tutorial 5.1 | MarinStatsLectures

Residual plots | Exploring bivariate numerical data | AP Statistics | Khan Academy
Logistic Regression Details Pt1: Coefficients
5.0 / 5 (0 votes)
Thanks for rating: