Advanced Regression - Categorical X variables and Interaction terms
TLDRThis video script delves into the intricacies of regression analysis, focusing on the use of categorical variables and interaction terms. It illustrates how to interpret the impact of binary and multicategorical explanatory variables on an outcome, such as the effect of a car's pink slip and age category on its resale price. The script also clarifies the misconception around interaction terms, emphasizing their role in capturing the effect of one variable modifying another's impact on the outcome, rather than indicating correlation between variables. A practical example of predicting a car's sale price using Excel regression analysis is provided, highlighting the importance of correctly incorporating categorical variables and interaction terms for accurate modeling.
Takeaways
- 📊 In Part B of the regression video, the focus is on using categorical explanatory variables in regression analysis.
- 🚗 An example is provided where the resale price of a car is a function of whether it has a pink slip, which is a binary categorical variable.
- 📈 The script explains how to interpret the coefficients in a regression equation, such as a car with a pink slip commanding a higher sale price on average.
- 🔢 The importance of p-values is discussed to determine the statistical significance of categorical variables in the model.
- 🔧 The concept of adding categorical variables to a more complex model is introduced, including variables like age and odometer reading.
- 📊 The script highlights the issue of non-significant categorical variables and how they may not help in explaining the dependent variable.
- 🔍 The process of dealing with binary X variables and categorical variables with multiple levels is explained.
- 🔧 The use of dummy variables is introduced to handle categorical variables with multiple levels, avoiding the dummy variable trap.
- 📊 The script demonstrates how to interpret the coefficients of categorical variables in the context of a regression model, particularly with reference to age categories.
- 🤝 The concept of interaction terms in regression modeling is introduced, explaining how they allow for the modification of the effect of one variable by another.
- 📈 An example is given where the presence of a university degree (binary variable) affects the relationship between age and salary.
- 📝 The script concludes with a practical exercise for the viewer to calculate the expected sale price of a specific car using the discussed regression model.
Q & A
What is the main focus of Part B of the regression video series?
-The main focus of Part B is to discuss the incorporation of categorical explanatory variables, particularly binary and multi-level categorical variables, into regression models and how to interpret their effects.
How does the presence of a pink slip affect the resale price of a car in the given example?
-In the example, a car with a pink slip would command a sale price that is $1626 higher than a car without a pink slip on average.
Why might the variable 'pink slip' not be statistically significant in the initial model?
-The 'pink slip' variable might not be statistically significant because its p-value is higher than the chosen significance level (e.g., 0.1), indicating that the variable may not have a strong or consistent effect on the car's resale price.
What is the issue with using a single categorical variable 'age cat' for car age with four levels in the regression model?
-The issue is that the model assumes a linear effect of age category increases on the price, which is not true in reality as the price pattern is more complex and non-linear. Additionally, this approach leads to the dummy variable trap, where one of the categories can be perfectly predicted by the others, thus not providing any unique information.
How does the use of dummy variables solve the problem of the dummy variable trap?
-Dummy variables solve the problem by creating separate binary variables for each age category (except one, which serves as the base case). This allows the model to compare each category to the base case without assuming a linear effect across categories.
What is the effect of including interaction terms in regression models?
-Including interaction terms allows the model to capture the combined effect of two variables on the outcome. It provides flexibility by enabling one variable to modify the effect of another variable on the dependent variable.
Why is it important to include interaction terms when one variable affects the relationship between another variable and the outcome?
-Interaction terms are important because they can reveal complex relationships that would otherwise be overlooked if the variables are treated as having independent and additive effects. This can lead to a more accurate and nuanced understanding of the data.
How does the effect of having a pink slip change depending on the age of the car in the model?
-For cars less than 35 years old, the effect of having a pink slip is relatively small (12.3% increase in price). However, for cars older than 35 years, the effect is much larger (149.4% increase in price), indicating that a pink slip is much more valuable for vintage cars.
What is the expected sale price of a 1974 Datsun 120y coupe with 290,000 kilometers on the odometer and a roadworthy certificate, according to the model?
-The expected sale price of the car, as calculated using the regression model, is approximately $8,400.
How does the log transformation of variables affect the interpretation of coefficients in a regression model?
-When variables are log-transformed, the coefficients represent the percentage change in the dependent variable for a one-unit change in the independent variable. This requires the use of exponential functions to convert the log of the expected value back to the original scale.
What is the significance of the p-value in determining the inclusion of variables in a regression model?
-The p-value helps determine if a variable is statistically significant. A low p-value (typically below 0.05) suggests that the variable has a significant effect on the outcome and should be included in the model. A high p-value indicates that the variable's effect may not be reliable.
Outlines
📊 Introduction to Categorical Variables in Regression Analysis
This paragraph introduces the concept of incorporating categorical variables, specifically binary variables, into regression analysis. The example given is the impact of a 'pink slip' (title) on a car's resale price, with the pink slip represented as a binary variable (1 for present, 0 for absent). The explanation includes how to interpret the regression output, stating that a car with a pink slip would, on average, command a higher sale price than one without. The paragraph also discusses the statistical significance of the variable, noting a high p-value and thus questioning its relevance in the model.
🔢 Handling Multiple Categorical Levels in Regression
This section delves into the challenges of including categorical variables with multiple levels in a regression model. It uses the example of car age, categorized into four groups, and the issues that arise when trying to include all categories simultaneously. The concept of dummy variables is introduced to resolve the 'dummy variable trap,' explaining how these variables represent each category except one, which is used as the baseline for comparison. The summary highlights the process of interpreting the coefficients for these dummy variables and the implications for the model's understanding of price differences among the age categories.
🤔 Exploring Interaction Terms in Regression Models
This paragraph discusses the concept of interaction terms in regression analysis, explaining how they allow for the modification of the effect of one independent variable by another. An example is given using employees' age and university degree status to predict salary. The explanation clarifies that an interaction term is necessary when one variable changes the impact of another on the dependent variable, and this is distinct from correlation between the variables. The summary emphasizes the importance of understanding the practical implications of interaction effects in model building.
🚗 Case Study: Pricing Vintage Cars with Interaction Effects
This section applies the concept of interaction terms to a specific example of pricing vintage cars. It introduces an interaction term between the vintage car category (age category 4) and the presence of a pink slip, hypothesizing that the combination of these factors may have an additional positive effect on the car's price. The summary explains how the interaction term is included in the regression model, the significant change in the model's output, and the interpretation of the coefficients, which reveal a substantial increase in price for vintage cars with a pink slip.
📝 Practical Exercise: Estimating the Sale Price of a Vintage Car
The paragraph concludes with a practical exercise, asking the viewer to calculate the expected sale price of a specific vintage car using the provided regression model. The car's details are given, including the year, odometer reading, and the presence of a roadworthy certificate. The summary guides the viewer through the process of applying the model's coefficients to these variables, calculating the expected log of price, and then transforming it to the actual price. The exercise reinforces the concepts discussed throughout the video and encourages active engagement with the material.
Mindmap
Keywords
💡Regression
💡Categorical Variables
💡Dummy Variables
💡Logarithmic Transformation
💡Coefficients
💡p-value
💡Interaction Terms
💡Dummy Variable Trap
💡Log-Linear Relationship
💡Proportionate Effect
💡Base Case
Highlights
Exploring regression analysis with categorical explanatory variables, specifically focusing on binary X variables.
Interpreting the impact of a binary variable, such as having a pink slip, on the resale price of a car, with an average increase of $1626.
Discussing the statistical significance of variables, noting that a high p-value may indicate a variable is not statistically significant.
Integrating categorical variables into a mature model series that includes both numerical and categorical variables.
Explaining the effect of a categorical variable on the Y variable in a log-linear regression model, where coefficients represent proportionate effects.
Addressing the issue of creating categorical variables from a continuous variable, such as age, and the need to avoid the dummy variable trap.
Demonstrating how to construct dummy variables for a categorical variable with multiple levels and the importance of choosing a base category.
Interpreting the coefficients of categorical variables in a regression model, showing how they represent the effect relative to a base category.
Discussing the impact of including interaction terms in regression models to capture the combined effect of two variables.
Clarifying the misconception that interaction terms are required when two variables are correlated, emphasizing that they are needed when one variable modifies the effect of another.
Applying the concept of interaction terms to a car sales model, where the age of the car interacts with the presence of a pink slip to affect the resale price.
Interpreting the coefficients of interaction terms, highlighting how the effect of one variable changes depending on the level of another variable.
Providing a practical example of calculating the expected sale price of a specific car using the developed regression model.
Emphasizing the importance of using precise coefficients for accurate predictions and acknowledging potential minor discrepancies due to rounded values.
Concluding with a challenge for the audience to apply the concepts learned and calculate the expected sale price of a 1974 Datsun 120y coupe using the provided model.
Transcripts
Browse More Related Video
Including Variables/ Factors in Regression with R, Part I | R Tutorial 5.7 | MarinStatsLectures
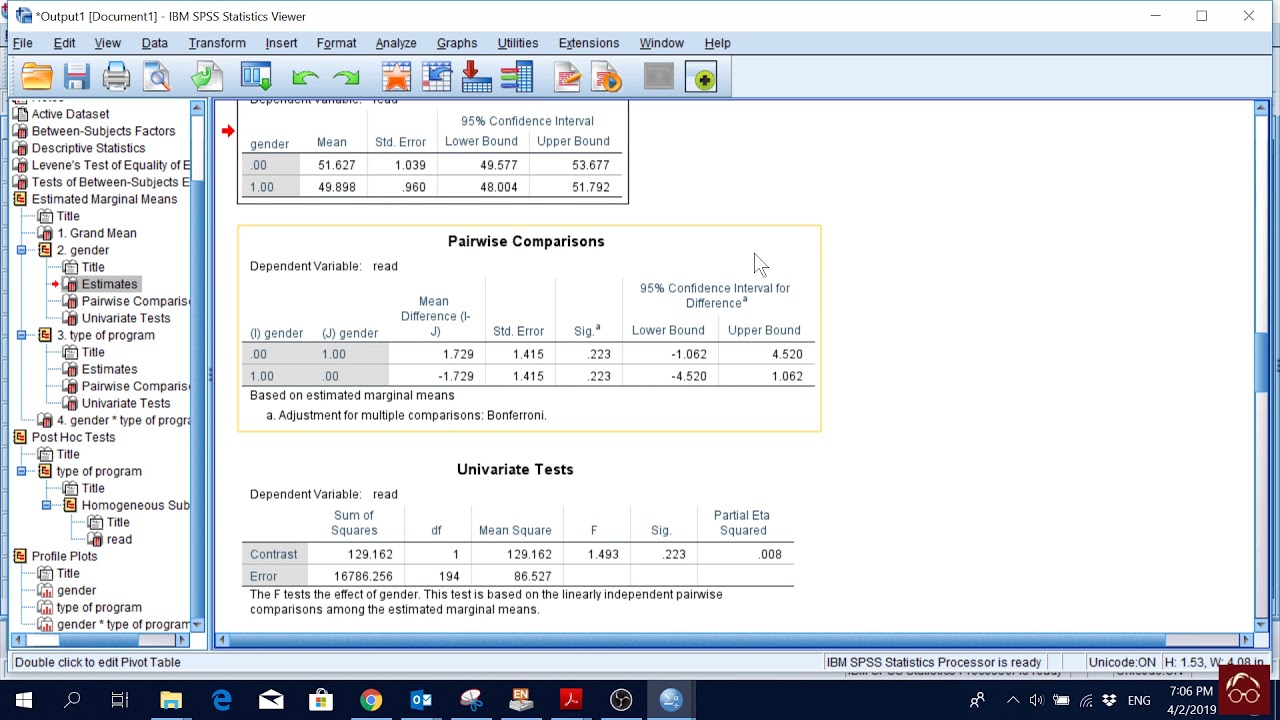
SPSS (11): Two-Way ANOVA (Interaction Effect of Two Categorical Variables)

Including Variables/ Factors in Regression with R, Part II | R Tutorial 5.8 | MarinStatsLectures

Multiple Linear Regression with Interaction in R | R Tutorial 5.9 | MarinStatsLectures

REGRESSION: Non-Linear relationships & Logarithms
Multiple Linear Regression in R | R Tutorial 5.3 | MarinStatsLectures
5.0 / 5 (0 votes)
Thanks for rating: