GCSE Physics Revision "Acceleration"
TLDRThis educational video script delves into the concept of acceleration, explaining it as the change in velocity over time. It guides students through the process of calculating acceleration using the formula and provides examples involving a car and a cyclist to illustrate the concept. The script further explores velocity-time graphs, explaining how to determine acceleration from the graph's gradient and how to calculate distance traveled by examining the total area under the graph. The content is tailored to different student tiers, with advanced concepts for high-tier students involving non-constant acceleration and complex graph analysis.
Takeaways
- 📚 Acceleration is the change in velocity of an object over a given time period.
- 🔢 The formula for calculating acceleration is acceleration (m/s²) = (change in velocity (m/s)) / time (s).
- 🚗 Example problem: A car accelerates from 50 m/s to 35 m/s in 20 seconds, resulting in an acceleration of 1 m/s².
- 🚴♂️ Deceleration is represented by a negative acceleration, such as a cyclist slowing down from 6 m/s to 0 m/s in 12 seconds, which is -5 m/s².
- 📈 Velocity-time graphs can be used to determine an object's acceleration by examining the gradient of the line.
- 🏁 Horizontal lines on a velocity-time graph indicate constant velocity, while upward or downward slopes indicate acceleration or deceleration.
- 🔄 To calculate the distance traveled from a velocity-time graph, the graph can be divided into shapes (triangles, rectangles) and the areas calculated.
- 🔢 For non-constant acceleration, the total area under the graph is found by counting and estimating the area of complete and partial squares.
- 📚 Understanding acceleration and its representation on velocity-time graphs is crucial for high-tier students.
- 📈 The total area under a velocity-time graph represents the displacement in a specific direction.
- 💡 Practice problems involving acceleration on velocity-time graphs can be found in the accompanying workbook.
Q & A
What is the definition of acceleration?
-Acceleration is the change in velocity of an object over a given time period.
How is acceleration calculated?
-Acceleration is calculated using the formula: acceleration (in meters per second squared) equals the change in velocity (in meters per second) divided by the time (in seconds).
What is the difference between velocity and acceleration?
-Velocity is the speed of an object in a given direction, while acceleration refers to the change in velocity over time.
How do you calculate the acceleration of a car that changes velocity from 50 m/s to 35 m/s in 20 seconds?
-The acceleration is calculated by (35 m/s - 50 m/s) / 20 s, which equals -1 m/s^2.
What does a negative acceleration value indicate?
-A negative acceleration value indicates deceleration, meaning the object is slowing down.
What does the gradient of a velocity-time graph represent?
-The gradient of a velocity-time graph represents the acceleration of the object. A horizontal line indicates constant velocity, an upward slope indicates acceleration, and a downward slope indicates deceleration.
How do you calculate the distance traveled by an object using a velocity-time graph?
-The total area under the velocity-time graph represents the distance traveled. For constant acceleration or deceleration, the graph can be divided into shapes like triangles and rectangles, and the areas can be calculated and summed up.
In the example given, how do you calculate the distance traveled by a cyclist whose velocity decreases from 6 m/s to 0 m/s in 12 seconds?
-The distance traveled is calculated by dividing the velocity-time graph into a triangle and a rectangle, finding the areas of these shapes, and adding them up to get the total distance.
What is the significance of the total area under a velocity-time graph in the context of motion?
-The total area under a velocity-time graph represents the displacement, or the total distance traveled by the object in a specific direction.
How do you handle a velocity-time graph with non-constant acceleration or deceleration?
-For a velocity-time graph with non-constant acceleration or deceleration, the total area under the graph is calculated by counting squares and estimating the areas of partial squares, then summing these areas to find the total distance or displacement.
What is the formula for calculating the area of a triangle in the context of a velocity-time graph?
-The area of a triangle in a velocity-time graph is calculated using the formula: 0.5 * base * height, where the base is the difference in velocity and the height is the time interval.
How can one use the information from a velocity-time graph to solve problems in physics?
-By understanding the relationship between the gradient of the graph and acceleration, as well as the area under the graph and displacement, one can solve a variety of problems in physics.
Outlines
📚 Introduction to Acceleration and Velocity Time Graphs
This paragraph introduces the concept of acceleration and its relationship with velocity. It explains that acceleration is the change in velocity over time, and provides the formula for calculating it: acceleration (in m/s^2) = (change in velocity in m/s) / time (in s). The paragraph also reviews the concept of velocity from a previous lesson, emphasizing that velocity is a vector quantity with both magnitude and direction. It presents a typical problem involving a car's acceleration and guides the audience to solve it by applying the formula. Additionally, it introduces the concept of deceleration and explains how to calculate an object's acceleration using a velocity-time graph. The paragraph concludes with an example of calculating acceleration from a graph and the meaning of the graph's gradient.
📐 Calculating Acceleration and Distance from Velocity-Time Graphs
This paragraph delves deeper into the application of velocity-time graphs for calculating both acceleration and distance traveled by an object. It explains how the gradient of a velocity-time graph represents the object's acceleration, with a horizontal line indicating constant velocity, an upward slope indicating acceleration, and a downward slope indicating deceleration. The paragraph provides a step-by-step guide on how to calculate acceleration from the graph by using the formula and subtracting initial and final velocities. It also introduces the concept of calculating distance traveled by examining the total area under the graph. The paragraph presents a method for calculating the area when acceleration or deceleration is not constant, instructing the audience to count squares under the graph and estimate the area of partial squares. The example given illustrates how to find the total distance or displacement by summing the areas of different geometric shapes formed under the graph. The paragraph concludes by mentioning additional resources for practice, directing the audience to a vision workbook available through a link.
Mindmap
Keywords
💡Acceleration
💡Velocity
💡Change in Velocity
💡Time
💡Deceleration
💡Velocity-Time Graph
💡Gradient
💡Displacement
💡Contextual Understanding
💡Problem Solving
Highlights
Welcome back to free size lessons, where this video aims to teach the concept of acceleration and its calculation.
Acceleration is the change in an object's velocity over a given time period.
The equation for calculating acceleration is given as 'acceleration in meters per second squared equals the change in velocity in meters per second divided by the time in seconds'.
A typical example is provided, where a car accelerates from 50 m/s to 35 m/s in 20 seconds, resulting in an acceleration of 1 m/s^2.
Another example involves a cyclist who decelerates from 6 m/s to 0 m/s in 12 seconds, with an acceleration of -2.5 m/s^2, demonstrating the concept of deceleration.
Velocity-time graphs can also be used to calculate an object's acceleration, where the gradient of the graph indicates the rate of change of velocity.
A horizontal line on a velocity-time graph indicates constant velocity, while upward and downward sloping lines indicate acceleration and deceleration, respectively.
The first part of the graph shows an acceleration calculation with an initial velocity of 0 m/s, a final velocity of 15 m/s, and a time of 100 seconds, resulting in an acceleration of 0.15 m/s^2.
In the last part of the graph, the object decelerates from 15 m/s to 0 m/s in 300 seconds, with an acceleration of -0.05 m/s^2.
The total area under a velocity-time graph represents the distance traveled in a specific direction, which is the displacement.
When there is constant acceleration or deceleration, the graph can be divided into shapes like triangles and rectangles to calculate the total area and thus the displacement.
For non-constant acceleration or deceleration, the total area under the graph is calculated by counting squares, with each square representing a unit of area.
An example is given where the total number of squares under the graph is 20, and with each square having an area of 250, the total displacement is 5,000 meters.
The video mentions a vision workbook with plenty of questions on acceleration on velocity-time graphs, which can be accessed by clicking on a link.
The video concludes with a recap of the importance of understanding acceleration and its calculation, as well as the application of velocity-time graphs in problem-solving.
Transcripts
Browse More Related Video

GCSE Physics - Velocity Time Graphs #54

High School Physics: Graphing Motion

Velocity Time Graphs, Acceleration & Position Time Graphs - Physics
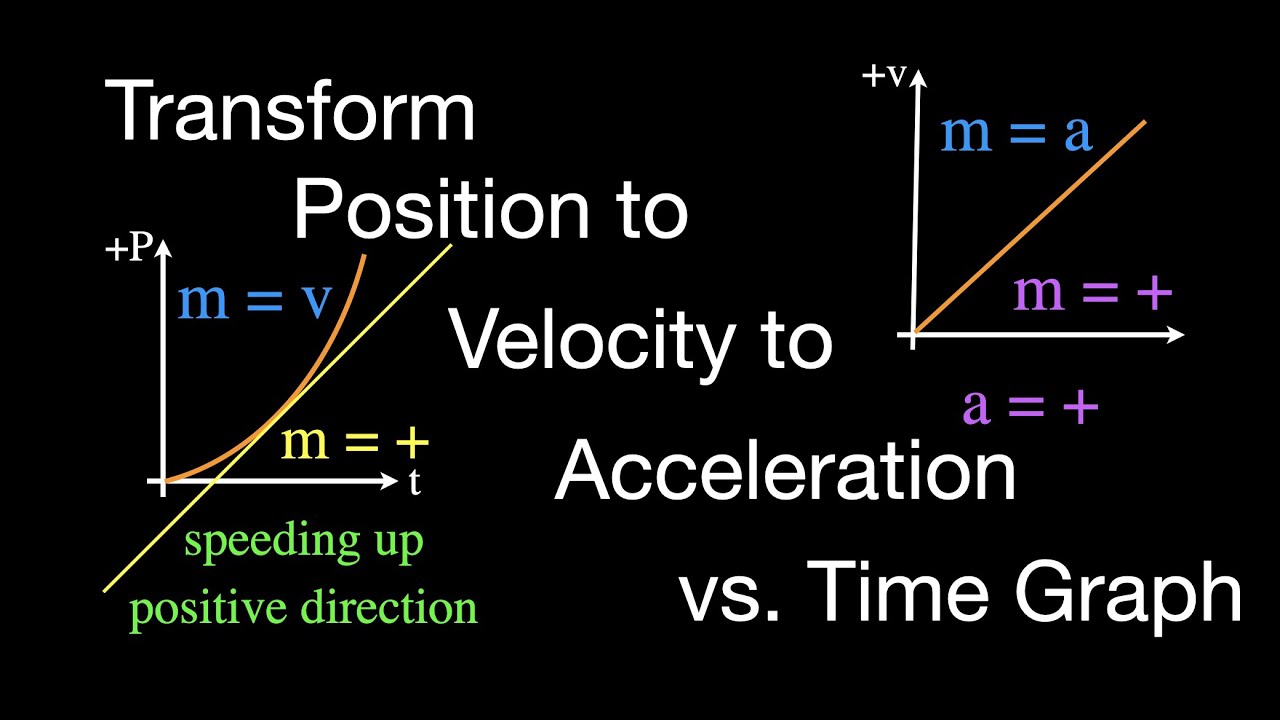
Motion Graphs: Transforming Position to Velocity to Acceleration vs Time

College Physics 1: Lecture 8 - Acceleration
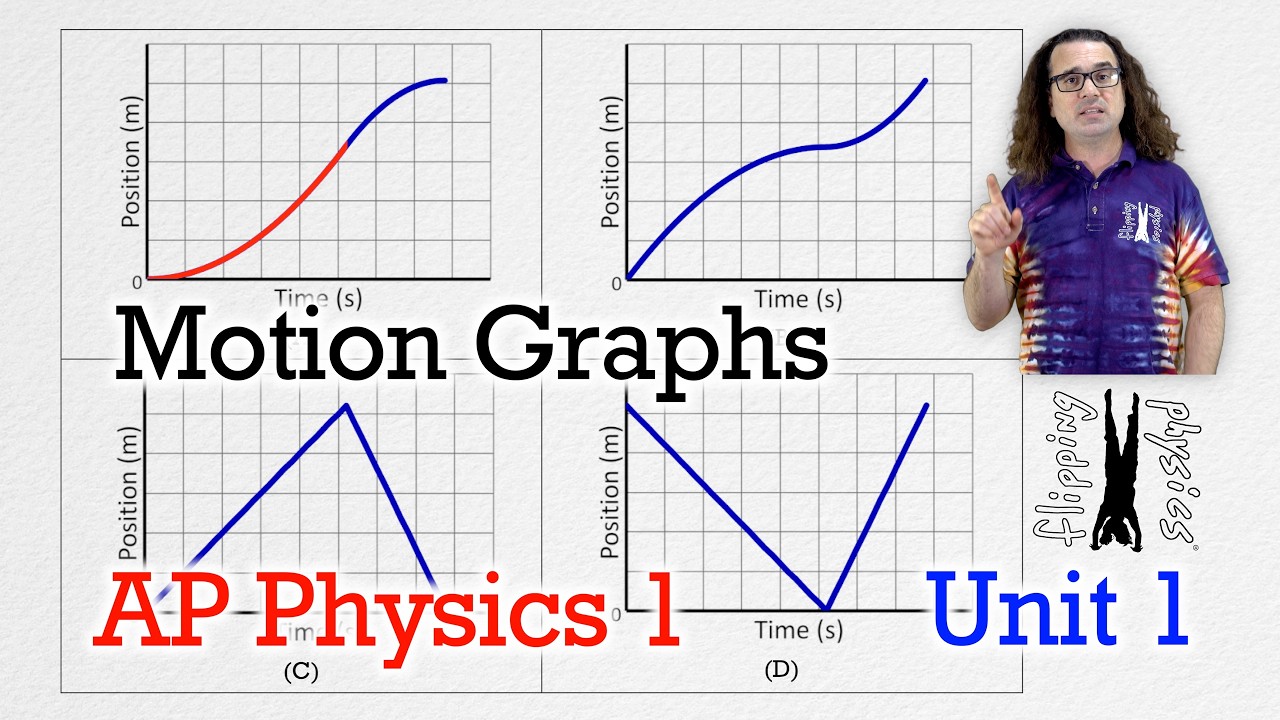
Motion Graphs - AP Physics 1: Kinematics Review Supplement
5.0 / 5 (0 votes)
Thanks for rating: