College Physics 1: Lecture 8 - Acceleration
TLDRThis lecture on 'College Physics 1' delves into acceleration, a fundamental concept describing how quickly an object's velocity changes. The instructor uses real-world examples, such as comparing the acceleration of different cars, to illustrate the concept. The lecture covers the definition of acceleration as the rate of change of velocity (delta v/delta t), its units (meters per second squared), and how to calculate it using a simple example involving a lion's acceleration. The instructor also explains the graphical representation of acceleration through velocity-time graphs, emphasizing that the slope of these graphs equates to acceleration. The lecture concludes with a discussion on the sign of acceleration, clarifying that it aligns with the velocity vector's direction for speeding up and opposes it when slowing down. The content is designed to prepare students for more complex physics concepts and equations related to motion with constant acceleration.
Takeaways
- 📚 The lecture introduces acceleration as the rate of change in an object's velocity, which is crucial for understanding how objects speed up or slow down in real-world scenarios.
- 🚗 It compares two vehicles, the Chevy Sonic and Corvette, to illustrate how acceleration varies between different objects, with the Corvette accelerating faster than the Sonic.
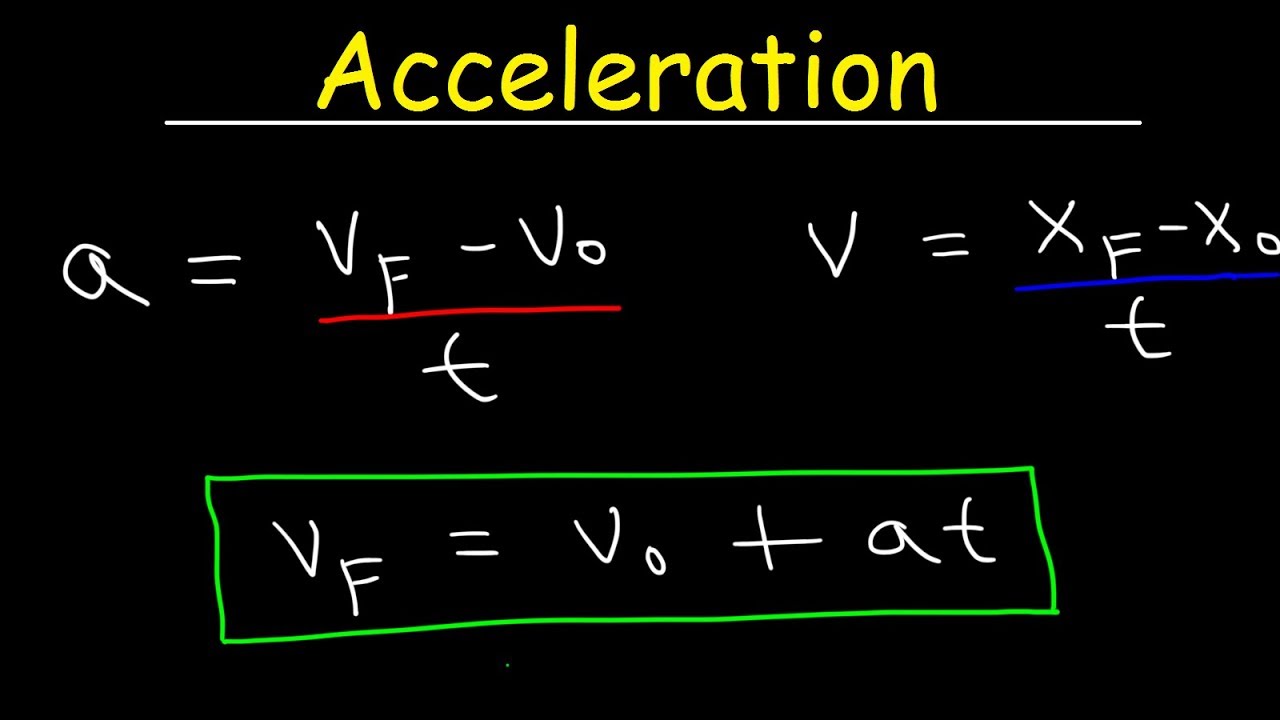
- 📉 The concept of acceleration is mathematically defined as the change in velocity (Δv) over the change in time (Δt), with units of meters per second squared (m/s²).
- 🦁 An example problem demonstrates how a lion, capable of an acceleration of 9.5 m/s², can reach a speed of 10 miles per hour (which converts to 4.5 m/s) from rest in approximately 0.47 seconds.
- 🔢 The importance of unit conversion is highlighted, as it is essential for solving physics problems involving different units of measurement, such as miles per hour to meters per second.
- 📈 The lecture explains that acceleration can be visualized graphically through a velocity-time graph, where the slope of the line represents the acceleration.
- 📊 The slope of a velocity-time graph is directly related to acceleration; a steeper slope indicates a greater acceleration, as seen when comparing the Corvette's and Sonic's graphs.
- 🔢 The lecture walks through the process of sketching acceleration versus time graphs based on velocity-time graphs, emphasizing that an object with constant acceleration will have a straight-line velocity graph.
- 🔄 The concept of negative and positive acceleration is discussed, clarifying that acceleration is a vector that points in the same direction as velocity when speeding up and in the opposite direction when slowing down.
- 📚 The lecture concludes with practice problems that reinforce the understanding of acceleration through various scenarios, including graphical representations and conceptual problems.
Q & A
What is the definition of velocity?
-Velocity is defined as the rate of change in an object's position, mathematically represented as delta x over delta t.
Why is acceleration necessary to describe motion?
-Acceleration is necessary to describe motion because in the real world, velocity rarely remains constant, and acceleration measures how rapidly an object's velocity is changing.
What is the formula for calculating acceleration?
-Acceleration is calculated using the formula delta v over delta t, where delta v is the change in velocity and delta t is the change in time.
What are the units for acceleration?
-The units for acceleration are meters per second squared (m/s²), derived from the units of velocity (m/s) divided by time (s).
How can you convert 10 miles per hour to meters per second?
-To convert 10 miles per hour to meters per second, you multiply by the conversion factor (1 mile = 1609 meters, 1 hour = 3600 seconds), resulting in 4.5 m/s.
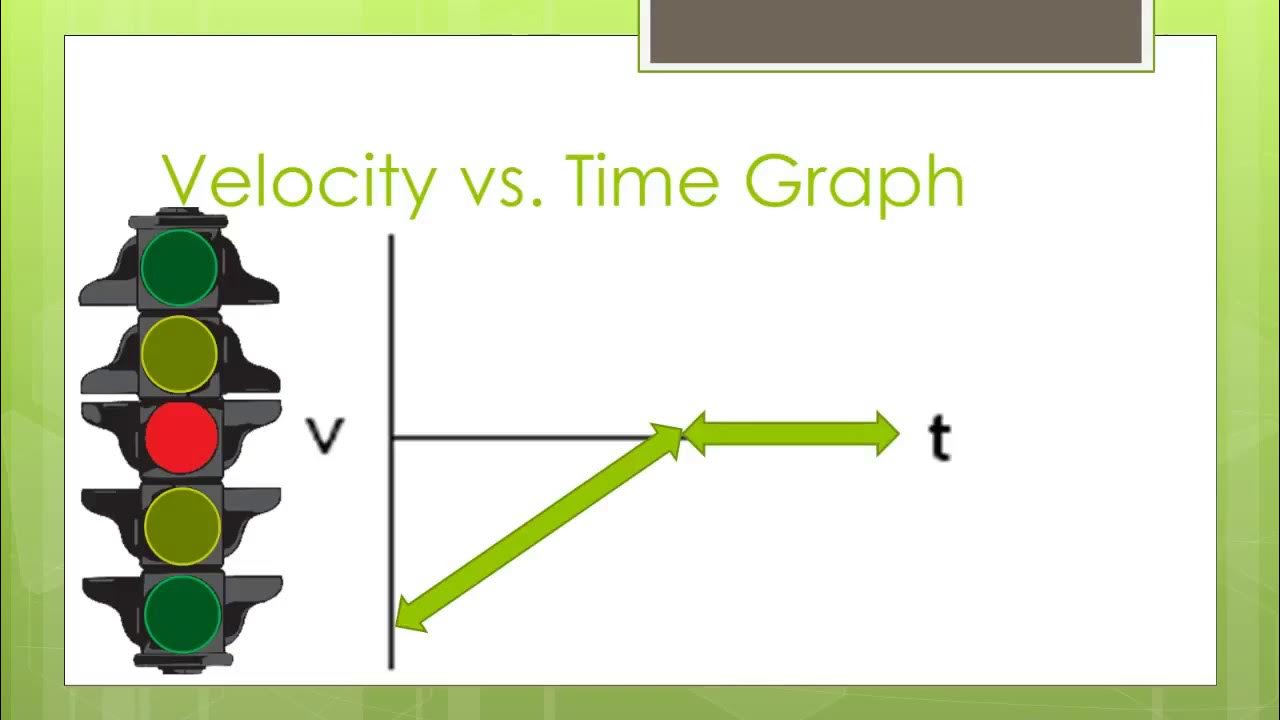
What does the slope of a velocity versus time graph represent?
-The slope of a velocity versus time graph represents acceleration, which is the rate of change of velocity over time.
How does the slope of the velocity graph compare between the Chevy Corvette and the Chevy Sonic in the example?
-The slope of the velocity graph for the Chevy Corvette is steeper than that of the Chevy Sonic, indicating that the Corvette has a greater acceleration.
What is the significance of the sign of acceleration?
-The sign of acceleration indicates whether the object is speeding up or slowing down. A positive acceleration means the object is speeding up in the positive direction or slowing down in the negative direction, while a negative acceleration indicates the object is slowing down in the positive direction or speeding up in the negative direction.
How can you determine if an object's acceleration is positive or negative based on its motion?
-An object's acceleration is positive if it is speeding up in the direction of its velocity or slowing down in the opposite direction. It is negative if it is slowing down in the direction of its velocity or speeding up in the opposite direction.
What is the relationship between the direction of an object's velocity and the direction of its acceleration?
-The acceleration vector points in the same direction as the velocity vector if the object is speeding up, and in the opposite direction if the object is slowing down.
Outlines
📚 Introduction to Acceleration in Physics
The lecture begins by introducing the concept of acceleration as the rate of change of an object's velocity. It explains that velocity is not always constant, and acceleration is needed to describe how quickly an object's speed changes. The lecture uses the example of a 2016 Chevy Sonic and a 2016 Chevy Corvette to illustrate the difference in acceleration between the two vehicles. The acceleration is defined mathematically as the change in velocity (delta v) over the change in time (delta t), with units of meters per second squared (m/s²). An example problem is presented involving a lion accelerating from rest to a speed of 10 miles per hour, highlighting the need for unit conversion from miles per hour to meters per second before applying the acceleration formula.
📈 Understanding Acceleration Through Graphs
This section delves deeper into acceleration by examining it graphically. The lecture uses the velocity-time graphs of the Chevy vehicles to illustrate that an object with constant acceleration will have a straight line on its velocity graph, with the slope representing the acceleration. The steeper the slope, the greater the acceleration. The lecture then guides through a thought experiment where students are asked to sketch acceleration-time graphs based on velocity-time graphs. It explains that if the velocity is increasing, the acceleration is positive, if it's constant, the acceleration is zero, and if it's decreasing, the acceleration is negative. The importance of understanding the relationship between the slope of the velocity graph and acceleration is emphasized.
🤔 Complex Visualization of Acceleration
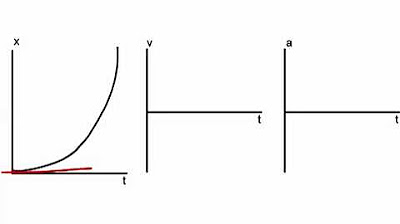
The lecture presents a challenging example involving a ball moving on a ramp to further illustrate the concept of acceleration. The ball's motion is divided into three segments: horizontal motion with constant velocity, increasing velocity as it rolls down the incline, and constant velocity again at the bottom of the ramp. Students are asked to sketch velocity-time and acceleration-time graphs for this scenario. The key takeaway is that during the first and third segments, where the velocity is constant, the acceleration is zero, while during the second segment, as the ball's velocity increases down the ramp, the acceleration is positive. This example reinforces the understanding that acceleration is the rate of change of velocity.
📉 The Significance of Acceleration's Direction
This part of the lecture discusses the sign of acceleration, clarifying that it is a vector quantity and its direction is the same as that of velocity when an object is speeding up, and opposite when an object is slowing down. Four different scenarios are presented to illustrate this concept: an object moving to the right and speeding up, moving to the right and slowing down, moving to the left and slowing down, and moving to the left and speeding up. The lecture emphasizes the importance of understanding that the direction of acceleration is not simply about speeding up or slowing down, but about the relationship between the direction of motion and the change in velocity.
🧐 Applying Acceleration Concepts to Motion Problems
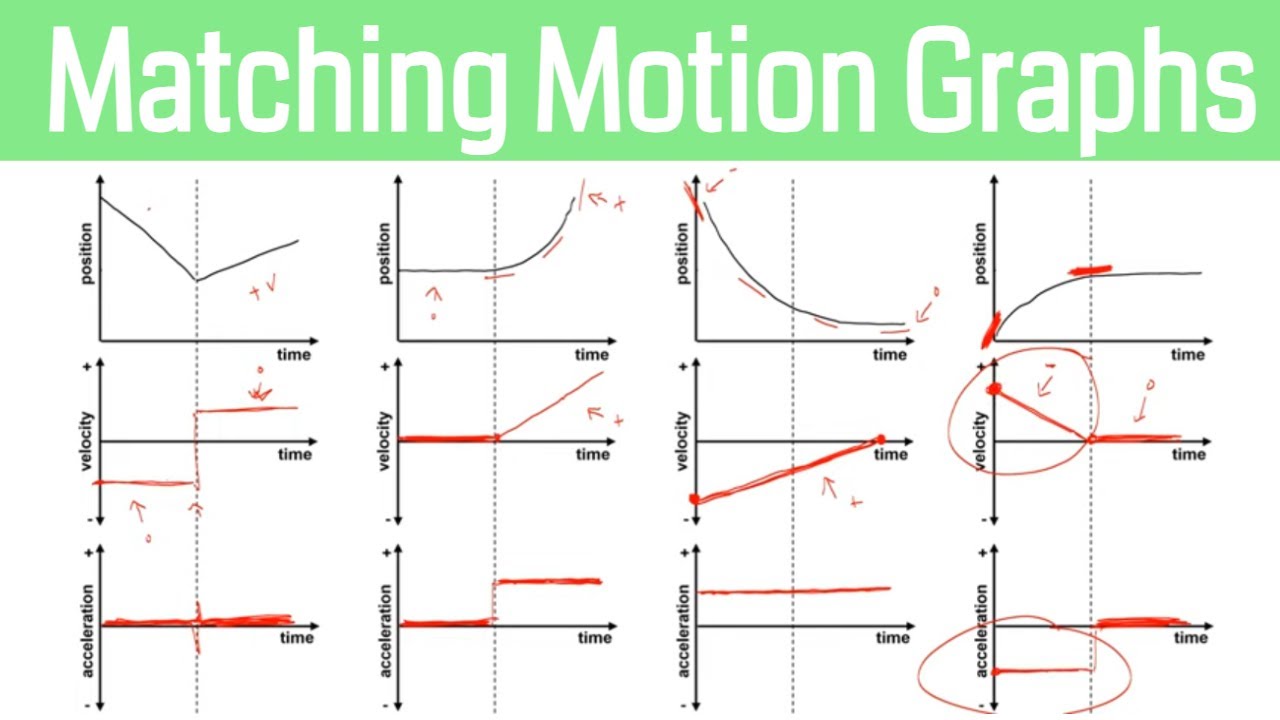
The lecture continues with a series of questions designed to reinforce the understanding of acceleration. It includes motion diagrams and asks students to determine the sign of position, velocity, and acceleration in various scenarios. The questions involve identifying whether an object's motion is to the right or left, whether it is speeding up or slowing down, and consequently, whether the acceleration is positive or negative. The lecture also includes graph-matching exercises where students must select the correct velocity and acceleration graphs that represent the described motion of a cart. These exercises are intended to solidify the concepts of acceleration and its application to real-world problems.
🚀 Conclusion and Preview of Upcoming Lectures
The lecture concludes with a brief mention of upcoming topics, which will involve more in-depth mathematical discussions on motion with constant acceleration. The lecturer promises to develop important equations that will describe the motion of objects under various conditions. The goal is to provide students with the tools to analyze and understand a wide range of motion scenarios. The lecture ends on a note of anticipation for the more complex, yet fascinating, topics that lie ahead in the course.
Mindmap
Keywords
💡Acceleration
💡Velocity
💡Unit Conversion
💡Meters per Second Squared
💡Slope
💡Friction
💡Constant Velocity
💡Graphs
💡Direction
💡Conceptual Problem
Highlights
Introduction to the concept of acceleration as the rate of change of an object's velocity.
Explanation of velocity as delta x over delta t, setting the foundation for acceleration.
Real-world application of acceleration with a comparison between the 2016 Chevy Sonic and Corvette's acceleration rates.
Graphical representation of how the Corvette's velocity vector increases more rapidly than the Sonic's, illustrating acceleration differences.
Definition of acceleration as the change in velocity over time, with units of meters per second squared.
Example problem involving a lion's acceleration from rest to a runner's top speed, demonstrating unit conversion and the application of acceleration.
Unit conversion from miles per hour to meters per second to solve physics problems.
Use of the acceleration equation to calculate the time it takes for a lion to reach a certain speed.
Graphical analysis of velocity and acceleration through a velocity graph of the Chevy Corvette and Sonic.
Understanding that an object with constant acceleration will have a straight line velocity graph, with the slope representing acceleration.
Sketching acceleration versus time graphs based on velocity versus time graphs, emphasizing the relationship between slope and acceleration.
Conceptual problem involving a ball moving on a ramp, requiring the visualization of velocity and acceleration graphs without given data.
Explanation of acceleration as a vector, pointing in the same direction as velocity when speeding up, and opposite when slowing down.
Discussion of the sign of acceleration, clarifying common misconceptions and emphasizing the directionality of acceleration relative to velocity.
Practice problems to reinforce the understanding of acceleration, including analyzing motion diagrams and graphing tasks.
Final summary emphasizing the importance of recognizing the direction of acceleration in relation to velocity's direction.
Preview of upcoming lectures focusing on the mathematics of motion with constant acceleration, introducing fundamental equations of motion.
Transcripts
Browse More Related Video


5.0 / 5 (0 votes)
Thanks for rating: