Finding The Area Bounded By Three Curves Using Definite Integrals - Calculus
TLDRThe video script explains the process of setting up an integral to find the area bounded by three curves when the points of intersection are unknown. It emphasizes the importance of sketching the graphs, finding the intersection points by equating the equations of the curves, and then calculating the area by integrating the difference between the upper and lower functions over the determined intervals. The method is demonstrated with a step-by-step approach, making it accessible for users to understand how to apply integrals in this context.
Takeaways
- 📈 Sketch the graphs: Begin by drawing a rough sketch of the three given graphs to visualize their intersections and the bounded area.
- 🔍 Identify the intersections: Determine the points of intersection between the given curves, which are essential for setting up the integrals.
- 📌 Intersection points: Find the intersection points by setting the equations of the curves equal to each other and solving for x and y values.
- 🌐 Widen the curve: For the graph y = (1/4)x^2, recognize that the 1/4 coefficient results in a wider opening compared to the standard parabola.
- 🔷 Transformed curve: Understand that the graph y = (1/4)k*x + 2 is a vertical shift of the basic (1/4)x^2 curve upwards by two units.
- 📍 Negative slope line: The equation y = -(1/2)x + 2 represents a straight line with a negative slope (m = -1/2) and a y-intercept (b = 2).
- 🧩 Break into regions: Divide the bounded area into two regions (Area 1 and Area 2) to simplify the process of finding the total area.
- 🔢 Set up the integrals: Use the intersection points to define the limits of integration and set up the integrals for each region separately.
- 📚 Factor and solve: Factor the resulting polynomials from the intersection equations and solve for x to find the additional intersection points.
- 🌟 Use definite integrals: Calculate the area between two curves by taking the definite integral of the top function minus the bottom function over the specified interval.
- 🔍 Verify solutions: Double-check the intersection points by plugging them back into the original equations to ensure they satisfy the conditions.
Q & A
What is the main topic of the video?
-The main topic of the video is how to set up an integral to find the area bounded by three curves or graphs.
Why is it necessary to draw a rough sketch of the graphs before proceeding with the calculations?
-Drawing a rough sketch of the graphs helps to visualize the area of interest and identify the points of intersection, which are crucial for setting up the integral.
What is the equation of the first curve mentioned in the video?
-The first curve mentioned in the video is y = 1/4 * x^2, which opens up wider due to the 1/4 coefficient in front of x^2.
How does the transformation of the curve y = <TK of X affect its starting point?
-The curve y = <TK of X has been shifted two units up, so it starts from positive two instead of the origin.
What is the slope-intercept form of the straight line mentioned in the video, and what are its slope and y-intercept?
-The straight line is in slope-intercept form as y = (-1/2)x + 2, with a slope of -1/2 and a y-intercept of 2.
How are the points of intersection found between the given curves?
-The points of intersection are found by setting the equations of the curves equal to each other and solving for x, which gives the x-values where the curves meet.
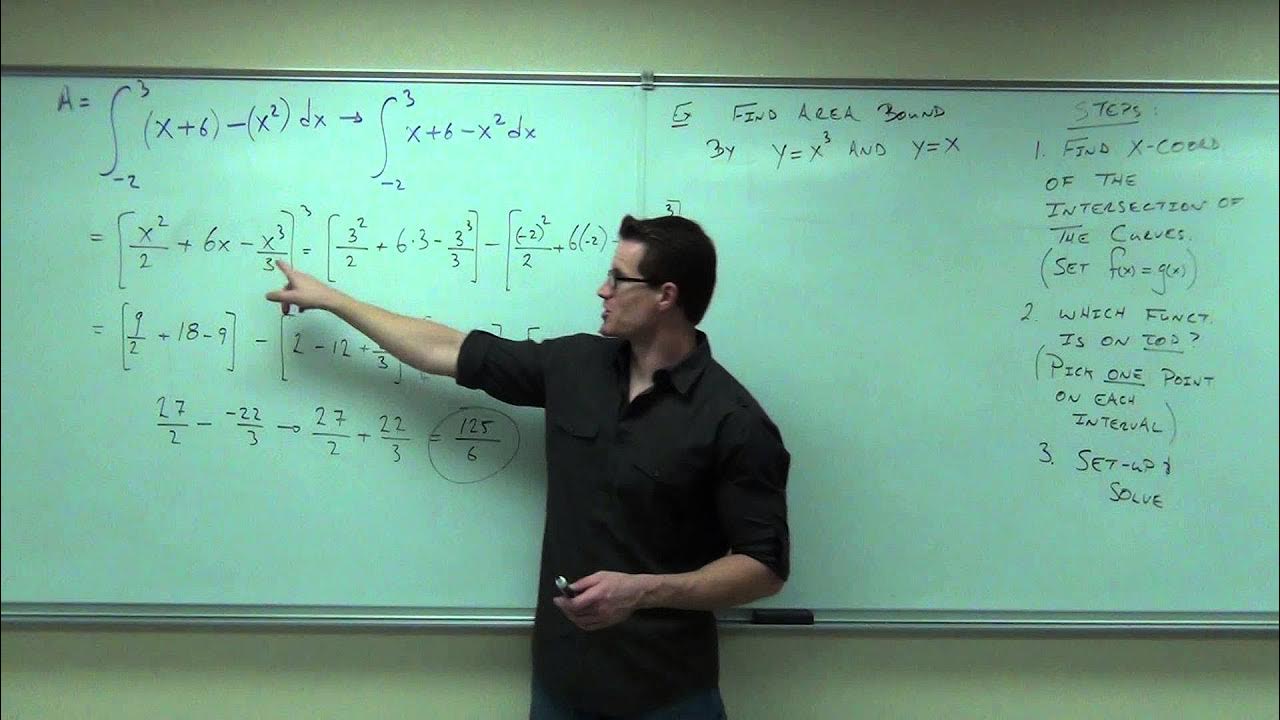
What is the integral expression for calculating the area between two curves from point A to point B?
-The integral expression for calculating the area between two curves is the definite integral from A to B of the top function (f(x)) minus the bottom function (g(x)), which is ∫ from A to B of (f(x) - g(x)) dx.
How is the integral set up for calculating Area 1 in the video?
-The integral for Area 1 is set up as ∫ from 0 to 2 of (<TK x + 2) - (-1/2x + 2) dx, with the top function being <TK x + 2 and the bottom function being -1/2x + 2.
What is the integral expression for calculating Area 2?
-The integral expression for Area 2 is ∫ from 2 to 4 of (<TK x + 2) - (1/4x^2) dx, with the top function being <TK x + 2 and the bottom function being 1/4x^2.
How is the total area of the shaded region calculated?
-The total area of the shaded region is calculated by summing the areas of the two regions, which is the first integral from 0 to 2 plus the second integral from 2 to 4.
What is the significance of the negative sign in the integral expressions?
-The negative sign in the integral expressions indicates that the lower function (bottom function) is subtracted from the upper function (top function), which is crucial for determining the correct area of the shaded region between the curves.
Outlines
📊 Introduction to Finding the Area Between Three Curves
This paragraph introduces the concept of setting up an integral to calculate the area bounded by three curves or graphs. The video will guide through the process of finding the points of intersection without explicit intersection coordinates. It emphasizes the importance of sketching the graphs, understanding the shapes and transformations of the functions, and identifying the points of interest. The paragraph sets the stage for the detailed calculations and integrals that will follow in the subsequent paragraphs.
🔍 Finding Points of Intersection and Setting Up Equations
The second paragraph delves into the process of finding the points of intersection between the given graphs. It explains the need to set up equations equal to each other to find the shared y-values at the points of intersection. The paragraph demonstrates the steps to solve for these points, including eliminating fractions, moving terms, and factoring expressions. It also highlights the importance of identifying the relevant points needed for calculating the area of the bounded region, even without an exact graph to scale.
📝 Calculating the Area Using Integrals
The final paragraph focuses on calculating the area of the region bounded by the three curves using integrals. It explains the method of finding the area between two curves by evaluating the difference of their functions over a specific interval. The paragraph outlines the integral expressions needed for calculating two separate areas (A1 and A2) and emphasizes the importance of the correct setup of the integrals, including the subtraction of the bottom function from the top function and the inclusion of the dx term. The total area is obtained by summing the areas calculated for each region.
Mindmap
Keywords
💡Integral
💡Graphs
💡Intersection Points
💡Area
💡Curves
💡Sketch
💡Equations
💡Factoring
💡Definite Integral
💡Limits
💡Shaded Region
Highlights
The video discusses setting up an integral to find the area bounded by three curves or graphs.
The first step is to draw a rough sketch of the graphs to visualize the area of interest.
The graph y = (1/4)x^2 is described as opening wider due to the 1/4 coefficient.
The graph y = <TK of X> + 2 is a shifted version of another graph, starting at positive two.
The straight line is characterized by a negative coefficient in front of the x term, indicating its direction.
The slope-intercept form of the line is identified with a slope (m) of 1/2 and a y-intercept (b) of 2.
Three points of intersection are noted as key to finding the area bounded by the curves.
The method for finding the points of intersection involves setting the equations of the two relevant graphs equal to each other.
The process of eliminating fractions and moving terms is detailed to simplify the equations for finding intersections.
Factoring is used to solve the equations and find the x-values of the points of intersection.
The video emphasizes the importance of identifying the correct points of intersection for accurate calculations.
The method for calculating the area between two curves using definite integrals is explained.
The integral expressions for calculating the area of the two regions (A1 and A2) are constructed.
The total area of the shaded region is determined by summing the areas calculated from the two integrals.
The video provides a comprehensive guide on using integrals to find the area bounded by multiple curves.
The process is shown to be applicable even without an exact graph, as long as the points of intersection are identifiable.
The video concludes with the integral expressions needed to calculate the total area of the shaded region.
Transcripts
Browse More Related Video
Calculus 1 Lecture 5.1: Finding Area Between Two Curves
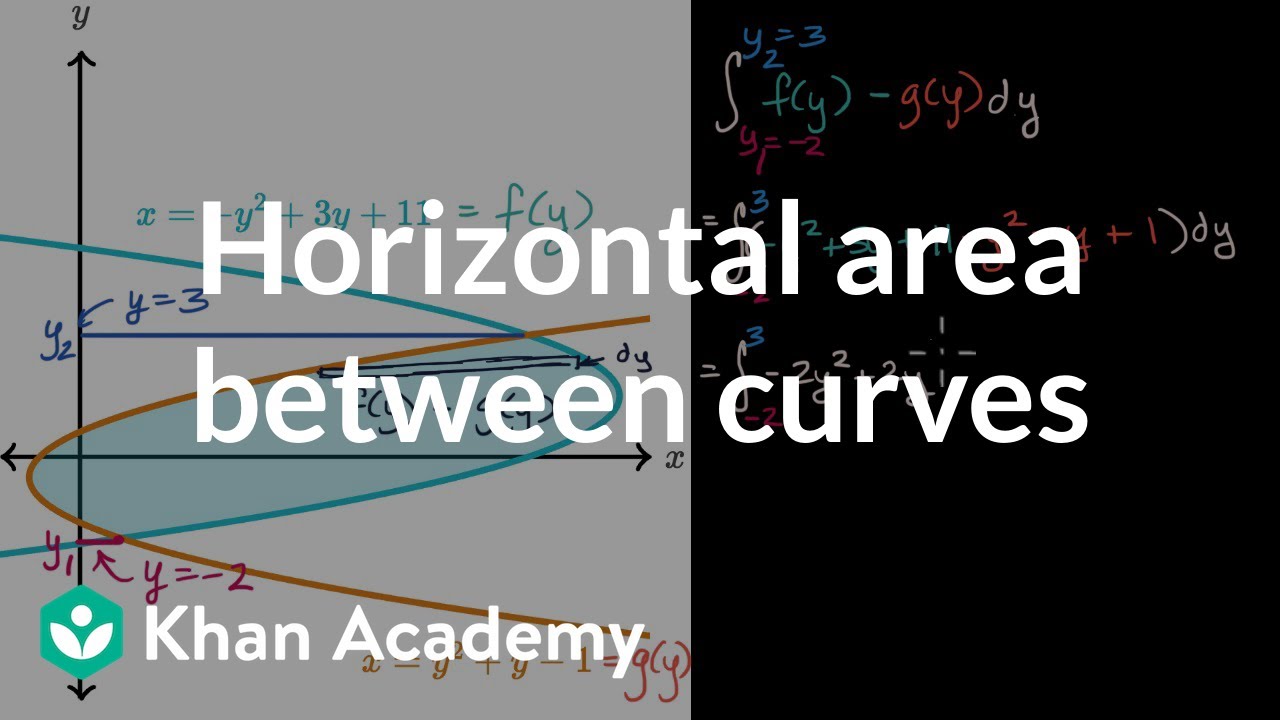
Horizontal area between curves | Applications of definite integrals | AP Calculus AB | Khan Academy
Finding the Area Between Two Curves by Integration

AP Calculus BC Lesson 9.9
Area between curves | Applications of definite integrals | AP Calculus AB | Khan Academy

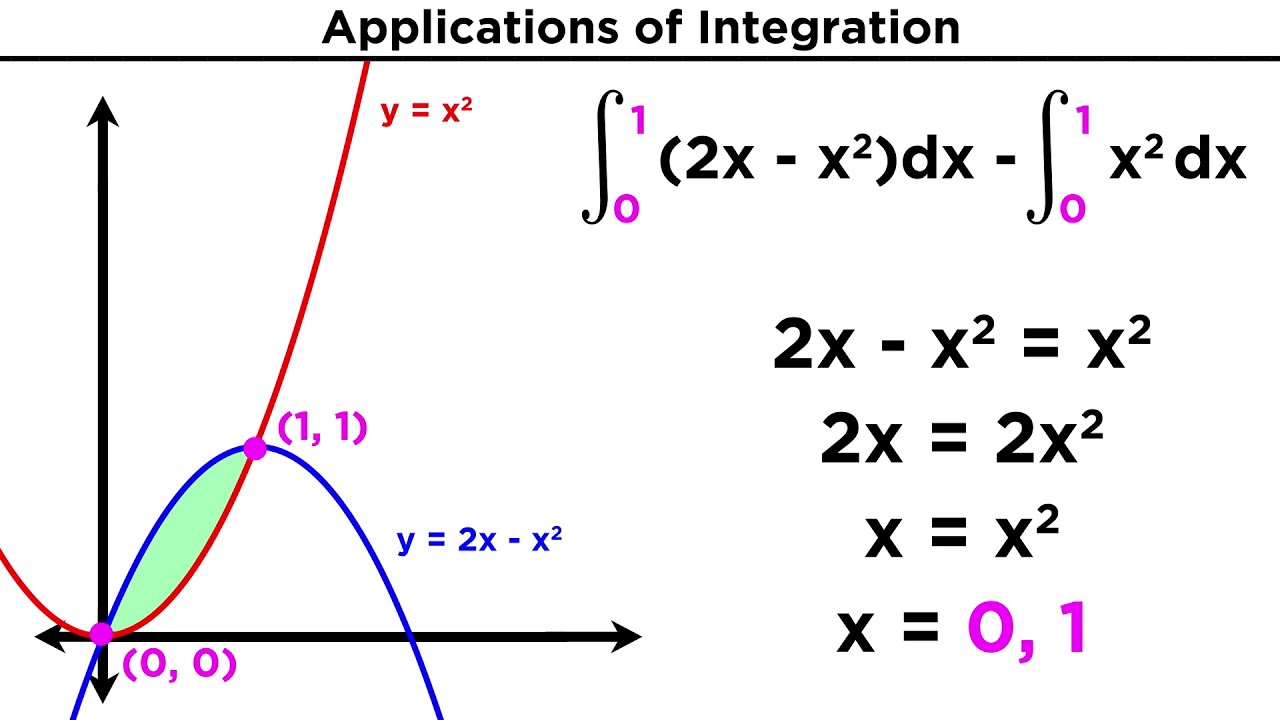
Area Between Two Curves-Curves that Cross
5.0 / 5 (0 votes)
Thanks for rating: