Population and Estimated Parameters, Clearly Explained!!!
TLDRIn this Stat Quest episode, Josh Stormer explains the fundamentals of statistics, focusing on population and parameters. He uses the example of mRNA transcripts in liver cells to illustrate how a histogram can be used to estimate population parameters from a sample. The video emphasizes that while the estimates from different experiments may vary, statistical methods like p-values and confidence intervals can confirm whether these variations are significant, ensuring the reproducibility of results.
Takeaways
- 🎵 The video is from Stat Quest, hosted by Josh Starmer, focusing on statistics fundamentals.
- 📊 The topic of discussion is population, parameters, and their estimation using a histogram and normal distribution.
- 🧬 An example is given where mRNA transcripts from gene X in liver cells are counted to illustrate the concept of population data.
- 🏪 The concept is also related to counting items like green apples in grocery stores or green t-shirts in clothing stores.
- 📈 A histogram is used to visualize the distribution of data, showing the number of occurrences for each value.
- 🔢 From the histogram, probabilities and statistics can be calculated, such as the likelihood of observing a certain number of mRNA transcripts.
- 📊 The normal distribution is used as an approximation for the real data, with a mean of 20 and a standard deviation of 10.
- 🔧 Population parameters are referred to as population mean and population standard deviation or population SD.
- 🌟 Other distributions like exponential and gamma could also be used to fit the data, depending on its shape.
- 🔍 Estimating population parameters from a sample is common practice due to limited resources and time.
- 🔄 The reproducibility of results from experiments is ensured by estimating population parameters and quantifying confidence in these estimates.
Q & A
What is the main topic of the Stat Quest video discussed in the transcript?
-The main topic of the video is statistics fundamentals, specifically focusing on the concepts of population, parameters, and how to estimate population parameters using a sample.
What are the three different examples given to illustrate the concept of measuring something in different units?
-The three examples given are counting the number of mRNA transcripts from gene X in liver cells, counting the number of green apples in different grocery stores, and counting the number of green t-shirts in different clothing stores.
How does the histogram of mRNA counts in all 240 billion liver cells relate to the normal distribution?
-The histogram corresponds to a normal distribution with a mean of 20 and a standard deviation of 10, which indicates how the data are spread around the mean.
What are population parameters in the context of statistics?
-Population parameters are the mean and standard deviation of the normal curve that represents the entire population, also referred to as the population mean and population standard deviation or population SD for short.
Why is it important to estimate population parameters instead of just describing the measurements taken?
-Estimating population parameters is important to ensure that the results drawn from an experiment are reproducible and can be applied to future experiments, providing a basis for more general insights about the population.
How does the estimated population mean and standard deviation change when more measurements are taken?
-As more measurements are taken, the estimated population mean and standard deviation get closer to the true population values, increasing the confidence in the accuracy of the estimates.
What are p-values and confidence intervals, and how do they relate to population estimates?
-P-values and confidence intervals are statistical tools used to quantify the confidence in estimated parameters. They help determine how significantly different two sets of estimates are, which is crucial for ensuring the reproducibility of experimental results.
What would be the impact of having only two measurements for estimating population parameters?
-Having only two measurements would result in less accurate estimates, with a larger margin of error, as the estimated mean and standard deviation would be farther from their true values.
How does the concept of a sample relate to estimating population parameters?
-A sample is a smaller subset of the larger population whose measurements are used to estimate the population parameters. The sample provides an approximation of the entire population's characteristics.
What is the significance of the normal curve in representing population data?
-The normal curve is significant because it provides a good approximation of the real data, allowing for the calculation of probabilities and statistics that can be generalized to the entire population.
What other statistical distributions could be used to represent population data besides the normal distribution?
-Other statistical distributions that could represent population data include the exponential distribution, determined by the rate, and the gamma distribution, determined by shape and rate parameters.
Outlines
📊 Introduction to Statistics Fundamentals
This paragraph introduces the video's focus on statistics fundamentals, specifically population and parameters. It uses the example of counting mRNA transcripts in liver cells to illustrate how data can be collected and represented through histograms and statistical distributions, particularly the normal distribution. The importance of understanding population parameters to ensure reproducibility in experiments is highlighted, and the concept of estimating these parameters from a sample is introduced.
🍏 Population Parameters and Distributions
The second paragraph delves into the concept of population parameters, emphasizing that a histogram represents an entire population and that the mean and standard deviation of a normal curve are known as population parameters. It explains how different distributions, such as exponential and gamma distributions, can be used to represent populations and calculate probabilities and statistics. The paragraph also touches on the applicability of these concepts to various statistical distributions.
🔢 Estimating Population Parameters and Reproducibility
This paragraph discusses the process of estimating population parameters from a sample and the importance of reproducibility in scientific experiments. It explains how different estimates from various samples can still yield similar results, and how statistics like p-values and confidence intervals can quantify the confidence in these estimates. The paragraph concludes by reinforcing the idea that estimating population parameters and understanding their confidence levels allows for the generation of reproducible results in future experiments.
Mindmap
Keywords
💡Ukulele
💡Stat Quest
💡Statistics Fundamentals
💡Histograms
💡Normal Distribution
💡Population
💡Parameters
💡Estimation
💡Reproducible Results
💡Confidence Intervals
💡Machine Learning
Highlights
The video introduces the concept of population and parameters in statistics, specifically focusing on fundamentals.
Histograms, statistical distributions, and the normal distribution are prerequisites for understanding the content.
An example is given where the number of mRNA transcripts from gene X in liver cells is counted, analogous to counting green apples in grocery stores.
A histogram can be used to calculate probabilities and statistics, such as the probability of observing a liver cell with 30 or more mRNA transcripts.
The histogram of mRNA counts in all 240 billion liver cells corresponds to a normal distribution with a mean of 20 and a standard deviation of 10.
Population parameters, such as the population mean and population standard deviation, are used to represent the entire population data.
Different distributions like exponential and gamma can fit data shapes and represent populations, with their own population parameters.
The importance of estimating population parameters from a sample for reproducibility in experiments is emphasized.
The estimated population mean and standard deviation from a small sample may differ from the true values but can still provide useful insights.
Having more data in the sample increases the confidence in the accuracy of the population parameter estimates.
Statistical methods like p-values and confidence intervals are used to quantify the confidence in estimated parameters.
Despite different estimates from separate experiments, statistical analysis can show that they are not significantly different, ensuring replicability.
The video encourages viewers to subscribe for more content on statistical concepts.
Support for the Stat Quest series is offered through purchasing merchandise like songs, t-shirts, or hoodies.
The video concludes by highlighting the importance of understanding population parameters for future experimental reproducibility.
Transcripts
Browse More Related Video
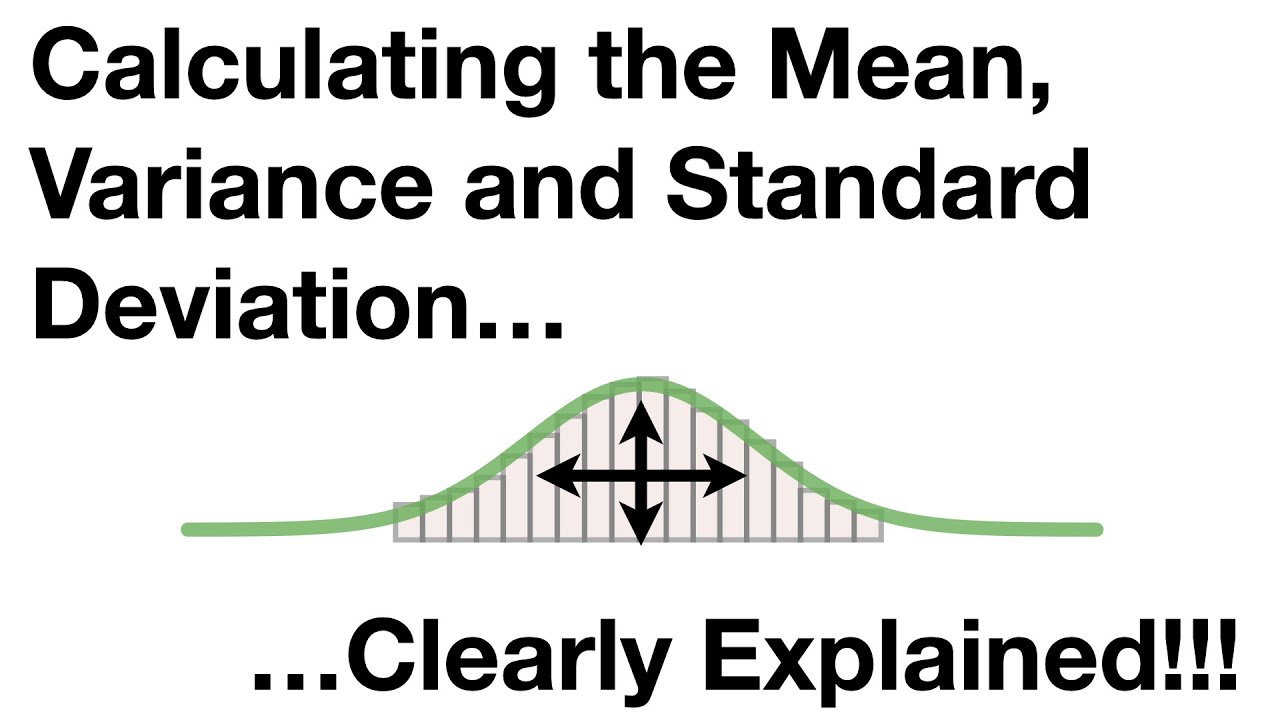
Calculating the Mean, Variance and Standard Deviation, Clearly Explained!!!
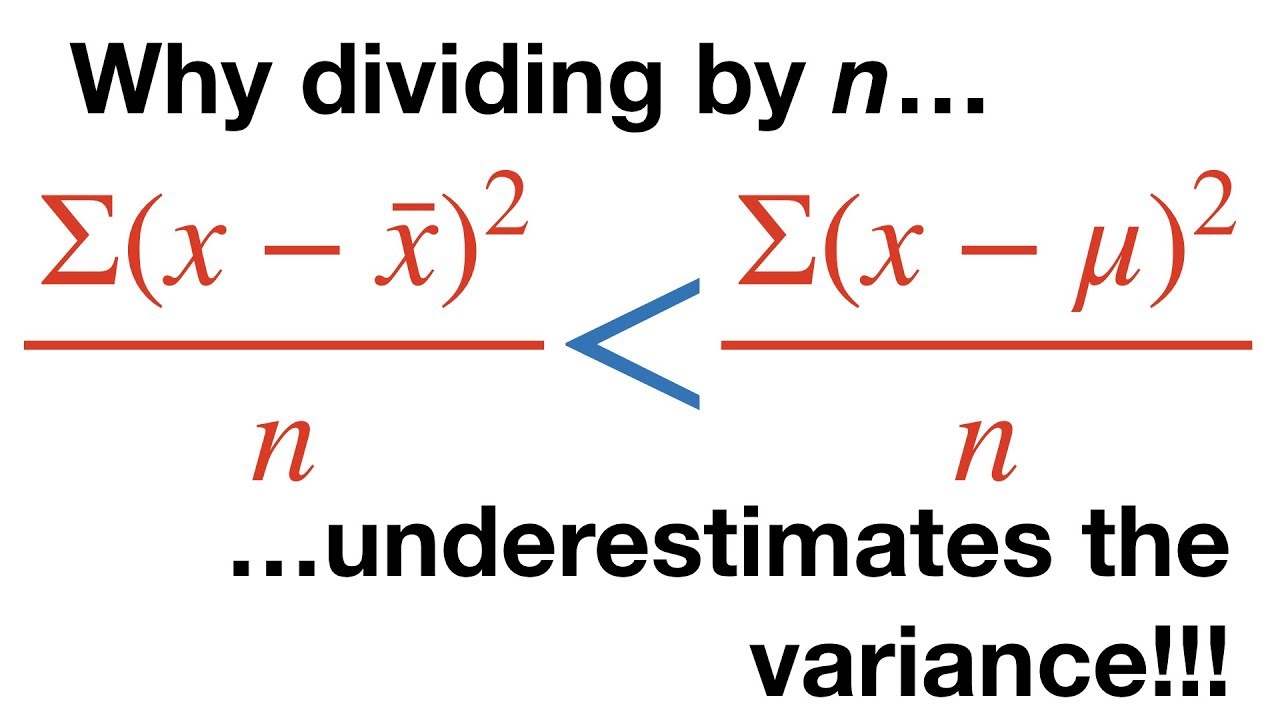
Why Dividing By N Underestimates the Variance
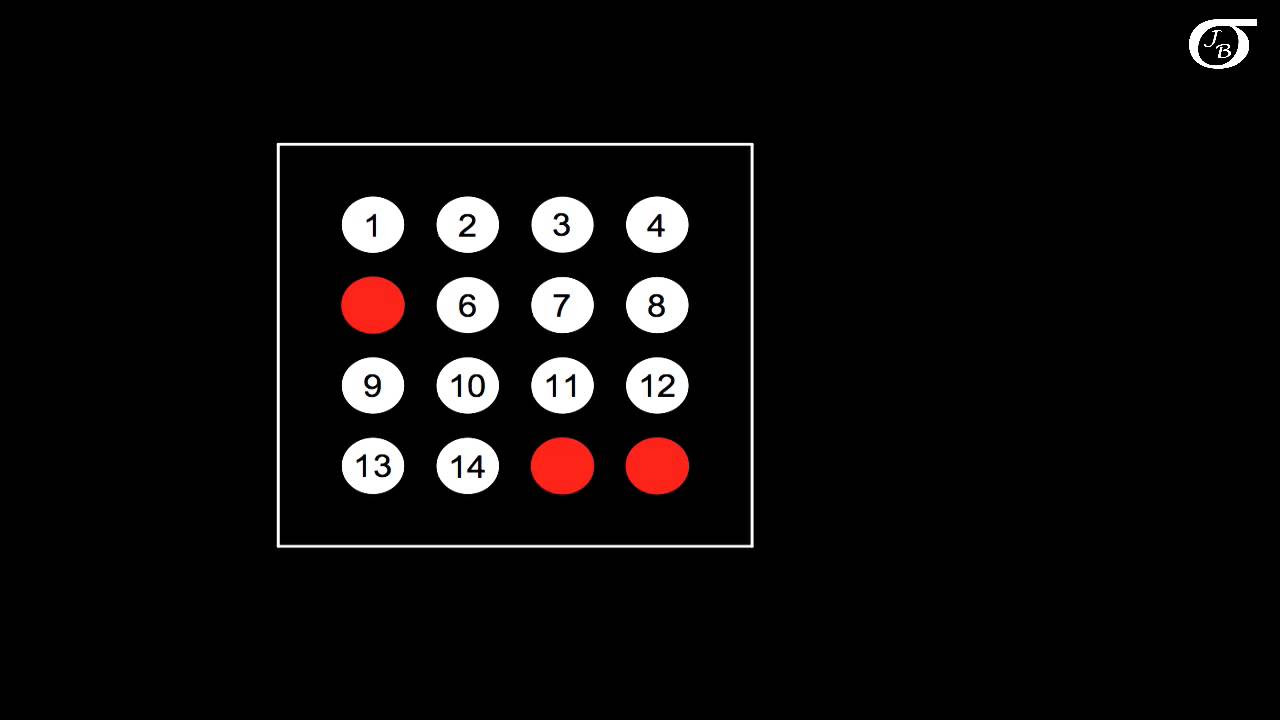
Sampling Distributions: Introduction to the Concept
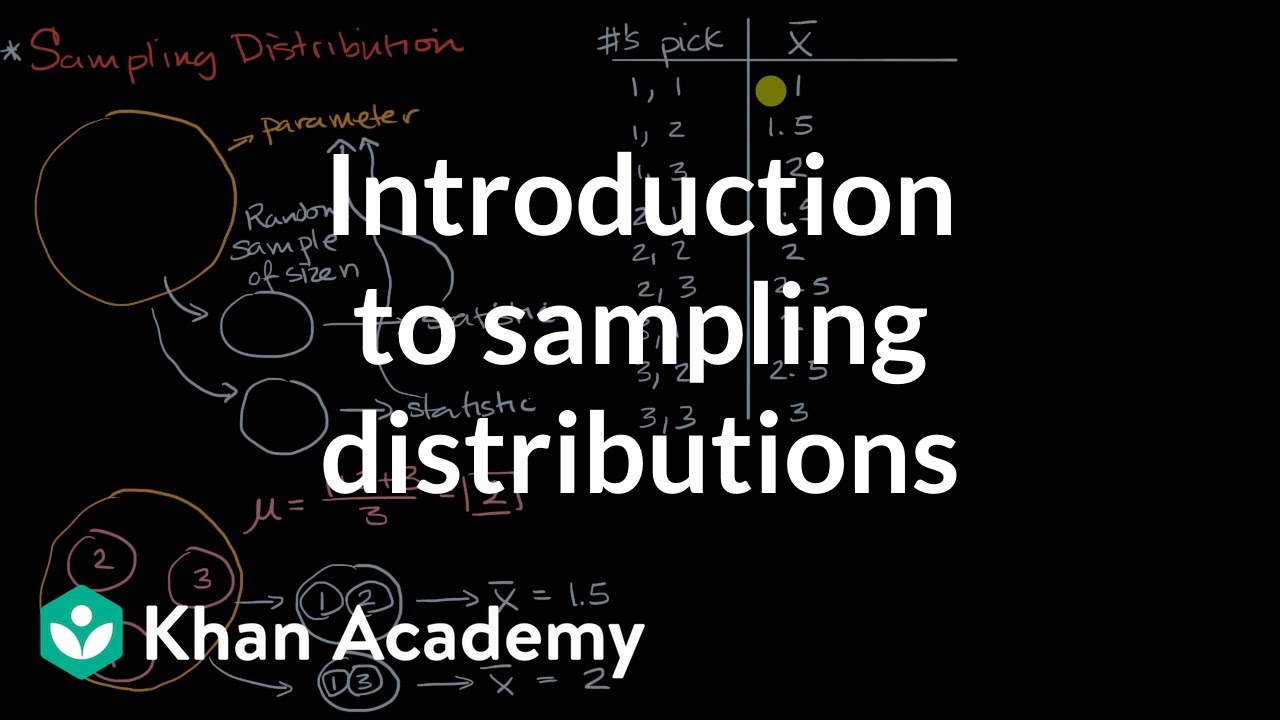
Introduction to sampling distributions | Sampling distributions | AP Statistics | Khan Academy
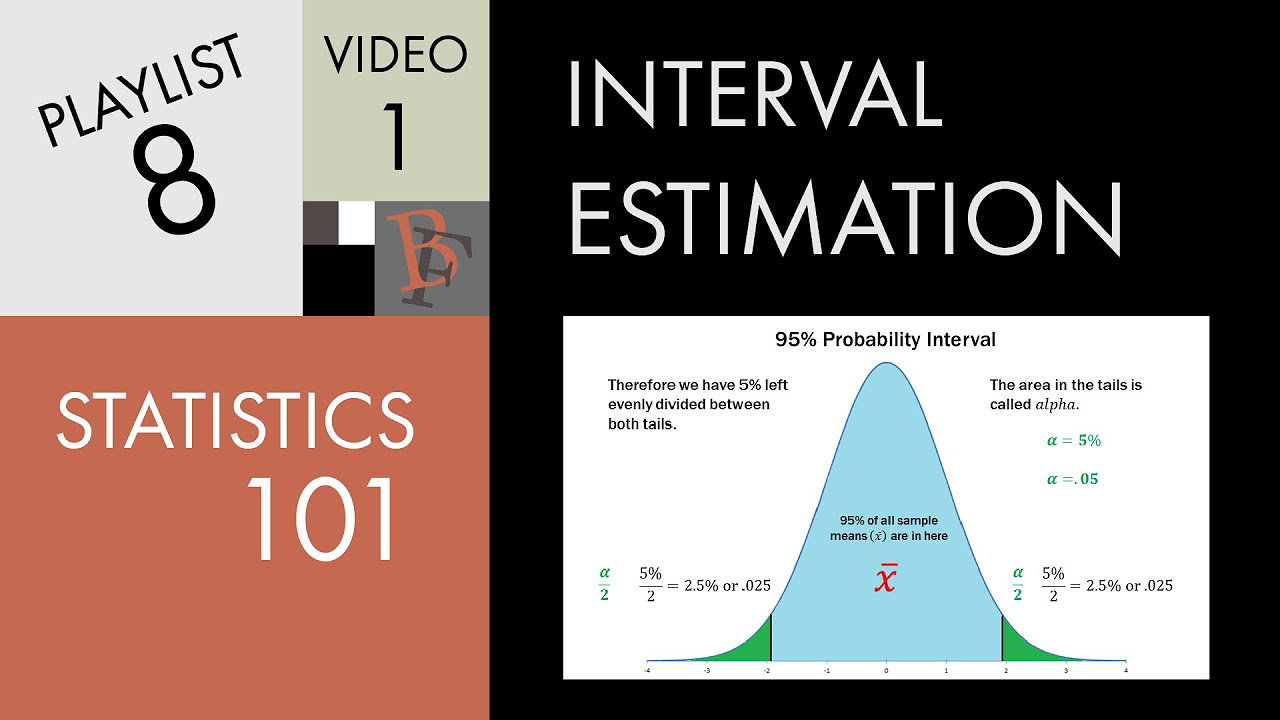
Statistics 101: Confidence Interval Estimation, Sigma Known
Understanding Confidence Intervals: Statistics Help
5.0 / 5 (0 votes)
Thanks for rating: