Interpreting behavior of _ from graph of _'=ÃÂ | AP Calculus AB | Khan Academy
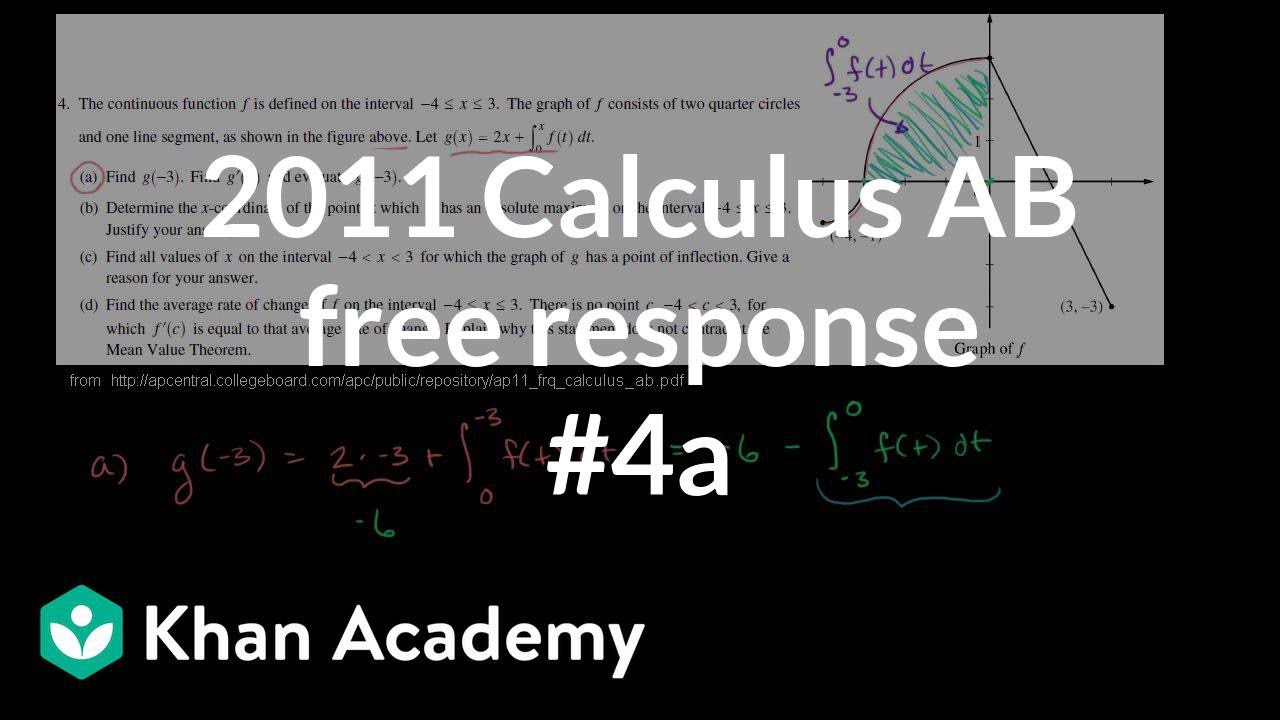
TLDRThe video script discusses the concept of concavity in calculus, specifically focusing on the function g(x) defined as the definite integral of f(t) from 0 to x. It explains that g'(x) equals f(x), and thus the concavity of g is related to the monotonicity of f. The script clarifies that for g to be concave up on an interval, f must be increasing there. It further explores the conditions for g to have a relative minimum at x=8, emphasizing the need for f to change from negative to positive. Lastly, it explains why g is positive on the closed interval from 7 to 12, attributing it to the positive area under the curve of f from 0 to x.
Takeaways
- 📌 The function g(x) is defined as the definite integral of f(t) from 0 to x, establishing the relationship g'(x) = f(x).
- 📈 To determine if g is concave up on an interval, one must examine if the derivative (f(x)) is increasing on that interval.
- 🔄 Being concave up means that the slope of the tangent line (or the derivative) is increasing.
- 🚫 Just because f(x) is positive on an interval does not imply that g(x) is concave up; it only indicates that g(x) is increasing.
- 🔼 A relative minimum at x=a for g(x) can be identified by the derivative f(x) changing from negative to positive at x=a, indicating a transition from decreasing to increasing.
- 🌐 For g(x) to be positive on a closed interval [a, b], the integral from a to b must result in a positive area under the curve of f(t).
- 🏋️♂️ The area under the curve of f(t) from 0 to x determines the value of g(x), and if the area is positive, g(x) will be positive on that interval.
- 📊 The graph of the derivative (f(x)) can provide insights into the concavity and local extrema of the original function (g(x)).
- 🔄 Understanding the relationship between the function and its derivative is crucial for analyzing the function's behavior, such as concavity and extrema.
- 📐 The concept of concavity and the analysis of local extrema are fundamental in calculus and are used to understand the shape and properties of functions.
Q & A
What is the relationship between g(x) and f(x) as defined in the transcript?
-The relationship between g(x) and f(x) is that g(x) is the definite integral of f(t) from 0 to x. This means that g'(x) is equal to f(x), indicating that the derivative of g at any point x is the value of f at that point.
What does it mean for a function to be concave up?
-A function is concave up if the slope of its tangent line is increasing. This can also be interpreted as the derivative of the function being increasing over a certain interval. In the context of the graph, if the graph of the derivative is rising, the original function is concave up on that interval.
Why is it not sufficient to say that g is concave up on an interval just because f is positive there?
-Simply stating that f is positive on an interval indicates that the original function g is increasing, but it does not provide information about the concavity of g. For g to be concave up, not only does f need to be positive, but it also needs to be increasing over the interval, which implies that the rate of increase of g is itself increasing.
How can we determine if g has a relative minimum at x equals eight?
-To determine if g has a relative minimum at x equals eight, we need to examine the behavior of its derivative f. Specifically, we look for a change in sign of f from negative to positive at x equals eight, which indicates a transition from decreasing to increasing, thus suggesting a relative minimum at that point.
What does the graph of f imply about the value of g on the closed interval from seven to 12?
-The graph of f implies that g is positive on the closed interval from seven to 12 because f(t) is positive from zero to seven and non-negative from seven to 12. This means that the area under the curve of f from zero to any x value within this interval is positive, and since no negative area is added or subtracted between seven and 12, g remains positive throughout this interval.
Why is the statement 'For an x value in the interval from seven to 12, the value of f(x) is zero' not a calculus-based justification for g being positive on that interval?
-This statement is incorrect because it does not consider the entire interval from zero to x. The value of f(x) alone does not determine the sign of the integral. The correct calculus-based justification involves the area under the curve of f from zero to any x within the interval, which remains positive if f is non-negative over that interval.
What is the significance of the area under the curve of f from zero to x in determining the sign of g(x)?
-The area under the curve of f from zero to x determines the sign of g(x) because g(x) represents the definite integral of f(t) from 0 to x. If the area under the curve is positive (meaning f(t) is above the x-axis), then g(x) will be positive. If the area is negative (f(t) is below the x-axis), then g(x) will be negative. The sign of g(x) is thus directly related to the accumulated area under the curve of f.
How does the concavity of f relate to the concavity of g?
-The concavity of f does not necessarily determine the concavity of g. While g'(x) = f(x), the concavity of g depends on the rate of change of the derivative, which is not solely dictated by the concavity of f. For example, even if f is concave up on an interval, g could be concave down if the interval is part of a larger region where the rate of increase of g is decreasing.
What is the role of the placeholder variable 't' in the context of the definite integral of f(t)?
-The placeholder variable 't' is used in the context of the definite integral of f(t) to represent the variable of integration. It is a standard practice in calculus to use a different variable (like 't') for integration to avoid confusion with the variable (in this case, 'x') that represents the upper limit of the integral.
How does the graph of the derivative of g (which is f) help in understanding the concavity of g?
-The graph of the derivative of g (f) provides insight into the rate of change of g. If the graph of f is increasing, this indicates that the rate at which g is changing is itself increasing, which is the definition of a concave up function. Conversely, if f were decreasing, g would be concave down.
What is the significance of f changing from negative to positive at x equals eight in determining a relative minimum for g?
-A change from negative to positive in the derivative f at x equals eight indicates that the function g transitions from decreasing to increasing at that point. This behavior is characteristic of a relative minimum, as the function moves from 'dipping down' to 'rising up,' passing through a point of least value or a minimum.
Outlines
📚 Understanding Concavity and the Derivative - g(x) as a Definite Integral
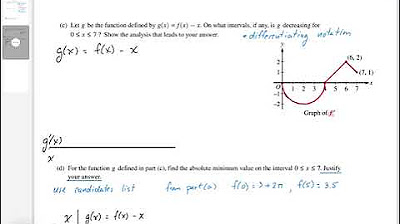
This paragraph discusses the relationship between a function g and its derivative f, where g(x) is defined as the definite integral of f(t) from 0 to x. The focus is on justifying why g is concave up on the interval from 5 to 10 using calculus. It explains that g'(x) = f(x), and by analyzing the graph of the derivative (f(x)), one can determine the concavity of g. The key takeaway is that if the derivative (f) is increasing on an interval, the original function (g) is concave up on that interval. The paragraph also clarifies that a positive derivative indicates an increasing function but does not necessarily mean the function is concave up. The discussion includes the importance of the sign change in the derivative to identify relative extrema, such as a relative minimum at x=8, which requires f to change from negative to positive around that point.
📈 Positivity of the Definite Integral - g(x) on a Closed Interval
This paragraph delves into the concept of the definite integral and its implications for the positivity of the function g on a closed interval from 7 to 12. It explains that g(x) represents the area under the curve of f(t) from 0 to x, which is positive when f(t) is above the x-axis. The paragraph clarifies that since the function f(t) is non-negative in the interval from 7 to 12, the value of g(x) remains constant and positive throughout this interval. The summary highlights the calculus-based reasoning behind the positivity of g on the given interval, emphasizing the importance of the integral's nature and the behavior of f(t) in determining the sign of g(x).
Mindmap
Keywords
💡Definite Integral
💡Derivative
💡Concave Up
💡Relative Minimum
💡Positive Function
💡Tangent Line
💡Interval
💡Rate of Change
💡Placeholder Variable
💡Area Under the Curve
💡Extremal Values
Highlights
The function g(x) is defined as the definite integral of f(t) from 0 to x.
The derivative of g(x) with respect to x is equal to f(x), illustrating the relationship between g and f.
The variable t serves as a placeholder to avoid confusion with the integration with respect to x.
Concavity of a function is related to the behavior of its derivative; if the derivative is increasing, the function is concave up.
A calculus-based justification for g being concave up on an interval requires showing that f (the derivative of g) is increasing on that interval.
A positive derivative indicates an increasing function, but does not necessarily mean the original function is concave up.
The graph of g can have a cup U shape on an interval, which is not a calculus-based justification for concavity.
For g to have a relative minimum at x=8, the derivative f must be zero at x=8 and change from negative to positive.
A relative minimum point is identified by a sign change in the derivative from negative to positive.
The value of g(x) being positive on a closed interval from 7 to 12 is due to the area under the curve f(t) being positive.
The integral from 0 to 7 is positive, and as x increases from 7 to 12, no negative area is added, thus g remains positive.
The value of g(x) is the same for any x in the closed interval from 7 to 12 because no additional area is added or subtracted.
The function f(t) is above the x-axis from 0 to 7, contributing to the positive value of g(x) on the interval from 7 to 12.
f(t) being positive from 0 to 7 and non-negative from 7 to 12 ensures that g(x) remains positive on the closed interval.
A calculus-based justification for g being positive on an interval involves understanding the definite integral and the area under the curve.
The relationship between the integral and the area under the curve is crucial for determining the sign of g(x) on a given interval.
The function's concavity and its derivative's sign change are key concepts in analyzing the behavior of g(x).
Transcripts
5.0 / 5 (0 votes)
Thanks for rating: