Another example graphing with derivatives | Differential Calculus | Khan Academy
TLDRThe video script presents a detailed walkthrough of finding the first and second derivatives of the function f(x) = ln(x^4 + 27) without a graphing calculator. It explains the process of differentiating the function using the chain rule and product rule, identifying critical points and inflection points by setting the derivatives equal to zero and examining sign changes. The script then proceeds to graph the function based on this analysis, ultimately verifying the手绘 graph with a graphing calculator, demonstrating the mathematical accuracy and the utility of derivatives in understanding the function's behavior.
Takeaways
- 📚 The function under discussion is f(x) = ln(x^4 + 27), where ln denotes the natural logarithm.
- 🔍 To graph the function without a calculator, the first step is to find the first derivative, f'(x) = (4x^3) / (x^4 + 27).
- 📈 The first derivative reveals the slope of the function at any given point and can help identify critical points where the slope is zero.
- 🔧 Applying the chain rule is crucial for finding the first derivative of composite functions like the one given.
- 📚 The second derivative, f''(x), is found using the product rule and helps in determining the concavity and inflection points of the function.
- 🔍 Setting the second derivative equal to zero and solving for x gives the candidate inflection points.
- 📈 To confirm if a point is an inflection point, check for a sign change in the second derivative around that point.
- 🔧 The process of finding the second derivative involves simplifying complex expressions and combining terms with a common denominator.
- 📚 The coordinate of the critical point at x=0 is (0, ln(27)) which is approximately (0, 3.29) and represents a minimum point due to the concavity.
- 🔍 The candidate inflection points at x = ±3 are confirmed by observing the change in concavity and the second derivative's sign around these points.
- 📈 The final graph of the function has a minimum point at x=0 and inflection points at x=±3, with the function changing from concave up to concave down at these points.
Q & A
What is the given function in the script?
-The given function is f(x) = ln(x^4) + 27.
How is the first derivative of the function found?
-The first derivative is found by applying the chain rule. The derivative of ln(u) is 1/u, and u is x^4 + 27. So, the derivative of the function is (4x^3)/( x^4 + 27).
What are the different forms the first derivative can be expressed in?
-The first derivative can be expressed as 4x^3/(x^4 + 27), or as 4x^3 * x^(-4) + 27^(-1), or as a negative exponent form, -4x^(-1).
How is the second derivative of the function calculated?
-The second derivative is calculated using the product rule. It involves taking the derivative of the first expression (4x^3) and multiplying it by the second expression (x^4 + 27 to the power of -1), and adding the first expression multiplied by the derivative of the second expression (4x^3 times the derivative of ln(x) which is 1/x).
What does the second derivative of the function evaluate to?
-The second derivative evaluates to (12x^2 * (x^4 + 27) - 16x^6) / (x^4 + 27)^2.
Why is it important to find where the first and second derivatives are equal to zero?
-Finding where the first and second derivatives are equal to zero helps identify critical points and potential inflection points, which are essential for understanding the function's behavior and graphing it accurately.
What is the significance of the second derivative being zero?
-The second derivative being zero indicates a potential inflection point. However, it is necessary to check for a sign change in the second derivative around these points to confirm that they are indeed inflection points.
What are the critical points of the function?
-The critical point of the function is x = 0, where the first derivative is zero. This point is identified as a minimum point since the function is concave upwards around this point.
Are x = +3 and x = -3 inflection points? How can you tell?
-Yes, x = +3 and x = -3 are inflection points. This can be told by observing that the second derivative changes sign around these points, indicating a change in concavity from concave up to concave down (or vice versa).
How does the graph of the function change as x approaches positive or negative infinity?
-The script does not explicitly discuss the behavior of the function as x approaches infinity. However, typically for functions involving natural logs and polynomial terms, the behavior near infinity would depend on the highest power term dominating the function's growth.
How does using a graphing calculator confirm the手绘 graph?
-The graphing calculator is used to graph the function, and the resulting graph is compared to the手绘 graph created based on the derivatives and critical/inflection points. A close match between the two confirms the accuracy of the手绘 graph and the mathematical analysis.
Outlines
📚 Calculus Concepts and Derivatives
This paragraph delves into the mathematical concepts of calculus, focusing on the computation of first and second derivatives of a function. The function in question is f(x) = ln(x)^4 + 27. The explanation begins with the process of finding the first derivative, using the chain rule to differentiate the natural logarithm component of the function. The paragraph then transitions into calculating the second derivative, which is more complex and requires the product rule. The main goal is to understand the function's behavior without using a graphing calculator, although a calculator is eventually used to verify the results.
🔍 Identifying Critical and Inflection Points
The second paragraph continues the mathematical analysis by discussing the importance of critical and inflection points in understanding the function's graph. It explains that while setting the first and second derivatives to zero can yield potential critical and inflection points, further analysis is required to confirm their nature. The paragraph emphasizes that a point where the second derivative is zero does not automatically signify an inflection point; a change in concavity (sign change in the second derivative) must also occur. The process of determining these points involves simplifying the second derivative and solving for x when the numerator equals zero.
📈 Analyzing the Function's Behavior
This paragraph is dedicated to examining the behavior of the function around the critical points identified earlier. It tests the concavity of the function by looking at the second derivative's sign as x approaches the critical points from both sides. The analysis reveals that x = 0 is a minimum point, not an inflection point, as the concavity does not change around this point. The paragraph also explores the behavior of the function around the candidate inflection points at x = ±3, confirming that these points indeed result in a change in concavity, thus qualifying as inflection points.
🖌️ Plotting the Function Graphically
The fourth paragraph focuses on the practical application of the mathematical analysis by plotting the function's graph. It provides a step-by-step guide on how to draw the graph based on the calculated critical and inflection points. The paragraph describes the graph's general shape, including the minimum point at x = 0 and the inflection points at x = ±3. It also discusses the concavity of the function around these points and how to represent this on the graph. The paragraph concludes with the use of a graphing calculator to verify the手绘 graph, reinforcing the correctness of the manual calculations and analysis.
Mindmap
Keywords
💡Natural Logarithm
💡Derivative
💡Critical Points
💡Inflection Points
💡Chain Rule
💡Product Rule
💡Slope
💡Concavity
💡Graphing Calculator
💡Sign Change
Highlights
The function f(x) = ln(x^4 + 27) is explored without the use of a graphing calculator.
The first derivative of the function is calculated using the chain rule.
The first derivative is simplified into multiple equivalent expressions.
The second derivative is derived using the product rule, leading to a complex expression.
The second derivative is simplified and expressed as a single fraction to find critical points.
The first derivative is found to never be zero or undefined, indicating a single critical point at x=0.
The critical point at x=0 is identified as a minimum, not an inflection point, due to consistent concavity.
Candidate inflection points are determined by setting the second derivative equal to zero.
The second derivative changes signs around x=±3, indicating these are inflection points.
The y-coordinates for the inflection points at x=±3 are calculated using the original function.
A手绘 graph is created based on the critical and inflection points, and the concavity of the function.
The手绘 graph is compared to the output of a graphing calculator to verify its accuracy.
The process demonstrates the utility of first and second derivatives in graphing and analyzing functions without technology.
The significance of inflection points in understanding the behavior of a function is emphasized.
The transcript provides a comprehensive walkthrough of the mathematical process, from derivatives to graphing.
The methodical approach to finding and verifying inflection points serves as a valuable learning tool.
Transcripts
Browse More Related Video
Graphing using derivatives | Derivative applications | Differential Calculus | Khan Academy
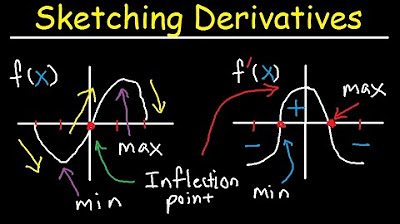
Sketching Derivatives From Parent Functions - f f' f'' Graphs - f(x), Calculus

Lec 11 | MIT 18.01 Single Variable Calculus, Fall 2007

Graphing with Calculus
Curve Sketching with Asymptotes x/(x - 2)^2 and Derivatives of Rational Function
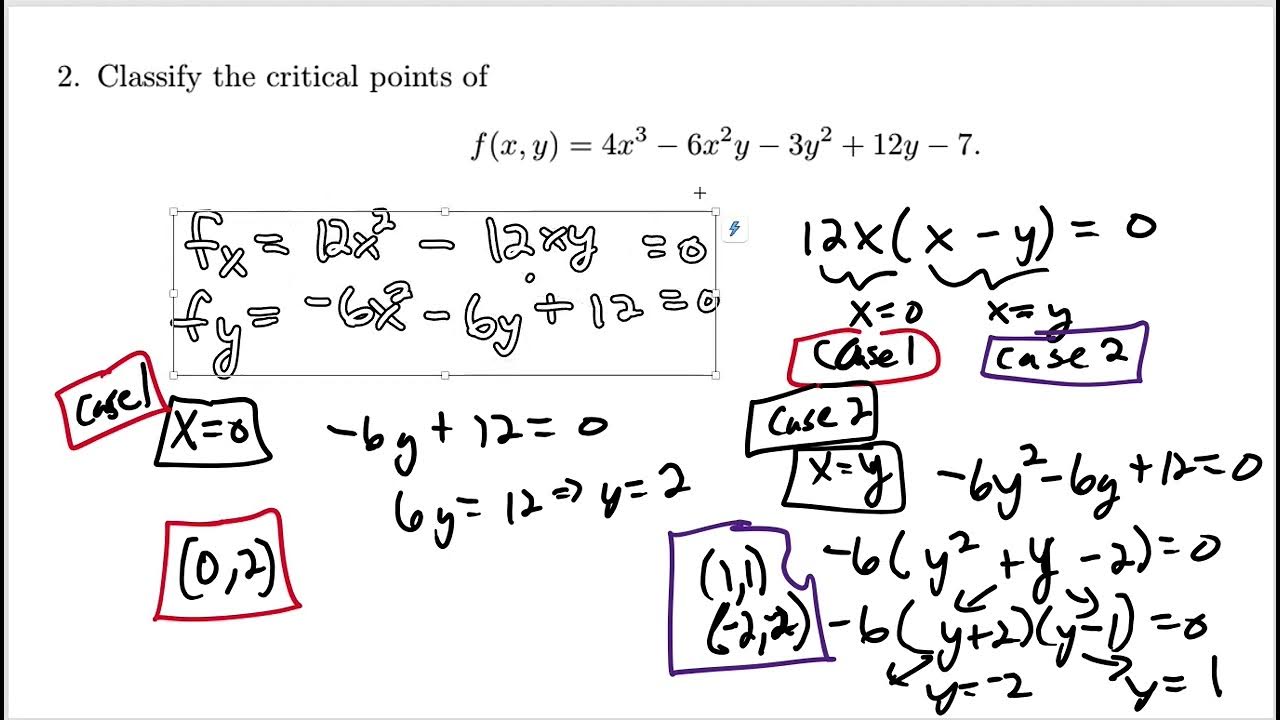
Find and classify critical points
5.0 / 5 (0 votes)
Thanks for rating: