Odds Ratios and Risk Ratios
TLDRThe transcript discusses the differences between odds, risk, and risk ratios, particularly in the context of medical research relating to drug exposure and health outcomes. It explains the concepts through examples of cohort and case-control studies, highlighting when to use odds or risk calculations. The importance of understanding denominators in these calculations is emphasized, as well as the significance of confidence intervals in determining statistical significance.
Takeaways
- 📊 Understanding the difference between odds, risk, and risk ratios is crucial for interpreting health data accurately.
- 🧬 The core question in such studies is determining the likelihood of a health outcome, such as a heart attack, due to a specific exposure like a drug.
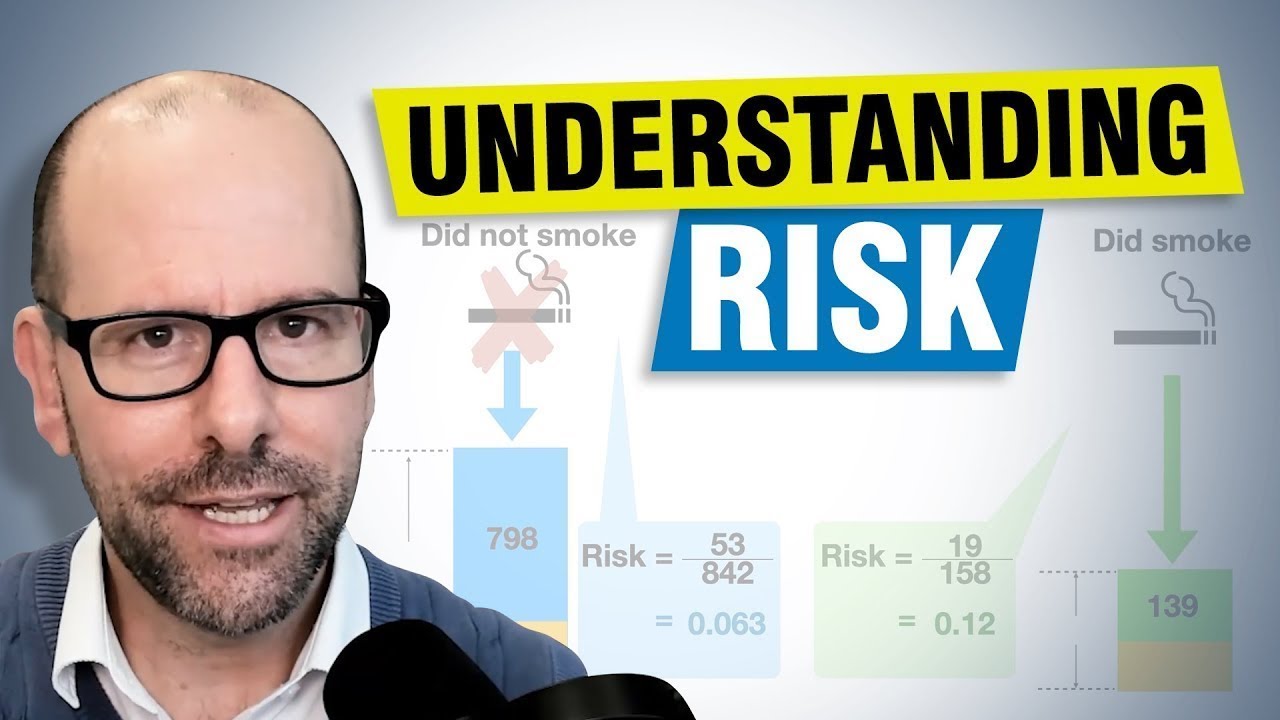
- 🎯 Probability (risk) is calculated as the number of people with an outcome (e.g., heart attack) over the total number of people in the study.
- 🔢 Odds are calculated as the number of people with an outcome over the number of people without that outcome.
- 🔄 In probability, the denominator includes all cases, while in odds, it only includes those without the outcome.
- 🧭 Maximum value for probability is 1, while odds can range from 0 to infinity.
- 🔍 Observational studies come in two main types: cohort studies and case-control studies.
- 👥 Cohort studies start with the exposure and follow to see if the outcome occurs, allowing for the calculation of risk.
- 🔙 Case-control studies start with the outcome and look back to see if the exposure occurred, which is where odds are used.
- ≈ In studies of rare diseases, odds can approximate probability, making odds ratios a useful measure.
- 📈 When interpreting odds ratios, consider the confidence intervals to determine statistical significance; if the interval includes 1, the result is not significant.
Q & A
What is the main difference between risk and odds?
-The main difference between risk and odds lies in the denominator they use. Risk is calculated as the number of people who experience a particular outcome (e.g., a heart attack) over the total number of people in the study. Odds, on the other hand, is the ratio of the number of people who experience the outcome to the number of people who do not.
What are the two types of studies mentioned in the transcript, and how do they differ in their approach?
-The two types of studies mentioned are cohort studies and case-control studies. In a cohort study, you start with a group of people exposed to a certain factor (like a drug) and a group not exposed, and then you observe who develops the outcome (e.g., heart attack). In a case-control study, you start with the outcome (e.g., people who had a heart attack) and look back to see who was exposed to the factor of interest (e.g., taking a particular pill).
Why is it important to understand the difference between probability and odds when dealing with rare diseases?
-Understanding the difference between probability and odds is important for rare diseases because when the disease is rare, the number of people without the disease is very large compared to those with it. In such cases, the odds and probability can be approximately the same, allowing odds to be used as an estimate for probability. This makes it easier to calculate and interpret the data in studies involving rare outcomes.
What can be calculated in a cohort study?
-In a cohort study, you can calculate the risk of the outcome (e.g., heart attack) in both the exposed group (those taking the drug) and the non-exposed group (those not taking the drug). You can then compare these risks to determine the relationship between the exposure and the outcome.
What is the purpose of calculating odds in a case-control study?
-In a case-control study, odds are calculated because the study starts with the outcome (e.g., heart attack) and looks back to identify exposure (e.g., drug use). Although it may seem counterintuitive, calculating odds in this manner allows for the determination of the odds ratio, which can approximate the risk ratio in the case of rare diseases, providing valuable information about the relationship between exposure and outcome.
What is an odds ratio, and how is it calculated?
-An odds ratio is a measure that compares the odds of an exposure (like taking a particular drug) between two groups: those with a specific outcome (e.g., heart attack) and those without. It is calculated by taking the odds of the exposure in the group with the outcome and dividing it by the odds of the exposure in the group without the outcome.
How can an odds ratio be used to estimate the risk in the context of rare diseases?
-In the context of rare diseases, the odds ratio can be used to estimate the risk because when the disease is rare, the odds and probability become approximately equal. Therefore, the odds ratio can serve as a good approximation for the risk ratio, allowing researchers to make inferences about the relationship between exposure and outcome even when they are only calculating odds.
Why is it crucial to consider confidence intervals when interpreting odds ratios?
-Confidence intervals provide a range of values within which the true odds ratio is likely to fall. If the confidence interval includes the value 1, it suggests that there is no statistically significant difference between the groups, meaning the exposure is not definitively associated with the outcome. This context is essential for determining the practical significance and reliability of the findings.
What does an odds ratio of 1 indicate about the relationship between exposure and outcome?
-An odds ratio of 1 indicates that there is no difference in the odds of the outcome (e.g., heart attack) between the exposed group (e.g., those taking the pill) and the non-exposed group (e.g., those not taking the pill). This suggests that the exposure does not affect the likelihood of the outcome occurring.
How do you interpret an odds ratio greater than 1 versus an odds ratio less than 1?
-An odds ratio greater than 1 suggests that the exposure (e.g., taking a particular drug) is associated with a higher likelihood of the outcome (e.g., heart attack) compared to those not exposed. Conversely, an odds ratio less than 1 indicates that the exposure is associated with a lower likelihood of the outcome, suggesting a protective effect or less frequent occurrence in the exposed group.
What is the significance of being able to calculate odds in a case-control study, even though the study design seems to work 'backwards'?
-The ability to calculate odds in a case-control study, despite the apparent 'backwards' design, is significant because it allows researchers to determine the association between exposure and outcome. Even though the study starts with the outcome and works backward to find exposure, the calculated odds ratio can provide valuable information about whether the exposure increases, decreases, or has no effect on the likelihood of the outcome, especially in the context of rare diseases.
Outlines
📊 Understanding Risk, Odds, and Study Types
This paragraph introduces the concepts of risk, odds, and risk ratios, emphasizing their importance in understanding the relationship between exposure (e.g., a drug) and health outcomes (e.g., heart attack). It clarifies the difference between risk and odds using a hypothetical scenario of ten patients taking a pill, where six experience a heart attack. The paragraph also explains the types of studies used to analyze these relationships: cohort studies, which follow a group from exposure to outcome, and case-control studies, which start with the outcome and investigate the exposure. The explanation is geared towards helping the viewer understand how these concepts are applied in medical research.
🧬 Case-Control Studies and Odds Calculation
This paragraph delves into the specifics of case-control studies, contrasting them with cohort studies. It explains how odds are calculated by comparing the number of exposed cases to the number of non-exposed controls. The paragraph uses an example where seven out of ten heart attack patients took a pill, and three did not, to illustrate the calculation of odds. It also addresses the limitations of case-control studies in calculating risk and the rationale behind using odds in these studies. The discussion highlights the importance of understanding the difference between calculating risk in cohort studies versus odds in case-control studies and the significance of odds in the context of rare diseases.
📈 Odds Ratio and Its Interpretation
This paragraph focuses on the calculation and interpretation of the odds ratio, which is a ratio of odds between exposed and non-exposed groups. It explains the mathematical process of deriving the odds ratio from the odds of exposure in those with and without a particular outcome. The paragraph clarifies that while odds ratios are not the same as risks, they can serve as a good approximation in the case of rare diseases. It emphasizes the importance of considering confidence intervals when interpreting odds ratios to determine statistical significance and the practical implications of different odds ratio values in understanding the relationship between exposure and outcomes.
🚫 Statistical Significance and Conclusion
The final paragraph wraps up the discussion by reiterating the key differences between calculating odds in case-control studies and risk in cohort studies. It underscores the importance of the denominator in determining whether to use odds or risk and how this affects the type of study used. The paragraph concludes with a reminder to always examine confidence intervals to assess the statistical significance of an odds ratio and to interpret the results within the context of the study's design and the disease's prevalence.
Mindmap
Keywords
💡Odds
💡Risk
💡Risk Ratio
💡Cohort Study
💡Case-Control Study
💡Exposure
💡Health Outcome
💡Probability
💡Denominator
💡Confidence Intervals
💡Statistically Significant
Highlights
The discussion focuses on clarifying the differences between odds, ratios, and risk ratios, which are often confused.
The context is the relationship between exposure to a certain drug and a health outcome, such as heart attacks.
Risk is defined as the probability of having a heart attack among those taking a particular drug.
Odds are the ratio of people who have had a heart attack to those who have not.
The maximum value for probability (risk) is 1, whereas odds can be infinite or zero.
Observational studies are categorized into cohort studies and case-control studies.
In a cohort study, the exposure is known at the start, and the outcome is observed over time.
Case-control studies begin with the outcome and look back to identify the exposure.
Cohort studies calculate risk, while case-control studies calculate odds.
Odds and probability are approximately the same when dealing with rare diseases.
The odds ratio is a ratio of odds, calculated by comparing the odds of exposure in those with an outcome to the odds of exposure in those without.
In case-control studies, the odds ratio can approximate the risk ratio, especially for rare diseases.
The odds ratio can be a useful measure even when starting with the outcome, as it can provide information about the likelihood of exposure causing the outcome.
Confidence intervals are crucial for determining statistical significance and should be examined to see if the number one is included.
An odds ratio of 1 indicates no difference in outcomes between the exposed and unexposed groups.
The video emphasizes the importance of understanding the denominator in calculating odds and probability, as it affects the interpretation of results.
The practical application of understanding odds and risk ratios is highlighted in the context of drug safety and efficacy studies.
The video provides a clear and detailed explanation of how to calculate and interpret odds and risk ratios, which is valuable for those involved in medical research and epidemiology.
Transcripts
Browse More Related Video

Relative Risk vs Odds Ratio! EXTENSIVE VIDEO!
Sample Size Calculation Made Easy - Case Control Study Design -HeDaL

Biostatistics SUMMARY STEP 1 - The Basics USMLE
Relative risk and risk ratios
Medical Statistics - Part 4: Calculating Odds

Case-Control Study and Odds Ratio | Statistics Tutorial #31| MarinStatsLectures
5.0 / 5 (0 votes)
Thanks for rating: