Relative Risk vs Odds Ratio! EXTENSIVE VIDEO!
TLDRThis video delves into the concepts of relative risk and odds ratio, essential measures in health statistics for comparing outcomes between groups with categorical exposures. Using examples, it explains how to calculate these measures and their interpretation. It highlights the necessity of odds ratios in case-control studies, especially for rare diseases, and contrasts this with prospective studies where relative risks are more applicable. The video also presents a chart illustrating the equivalence between relative risk and odds ratio in different scenarios and concludes with real-world research examples demonstrating the application of these statistical measures.
Takeaways
- 📈 Relative Risk (RR) and Odds Ratio are measures of group comparison used in health statistics to compare the probability of a negative outcome between two exposure groups.
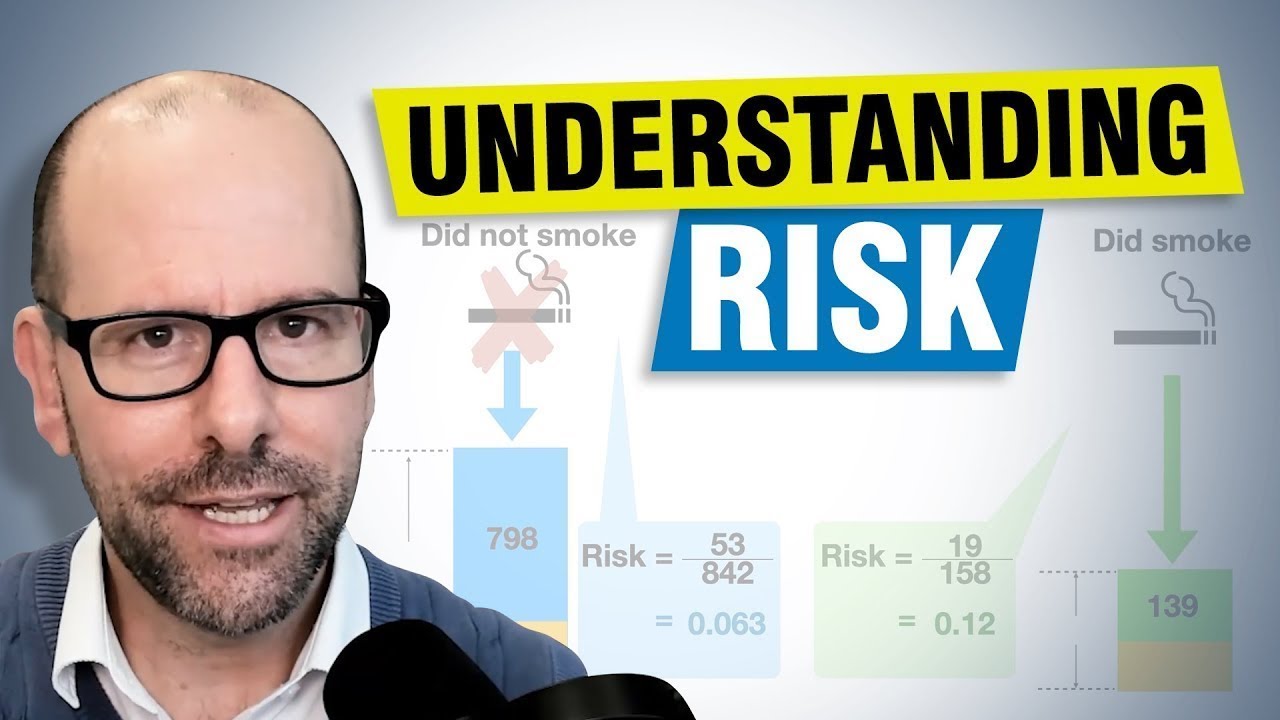
- 🔢 To calculate RR, you divide the risk of the exposed group (e.g., those with a certain condition) by the risk of the unexposed group, indicating how much more or less likely the outcome is in the exposed group.
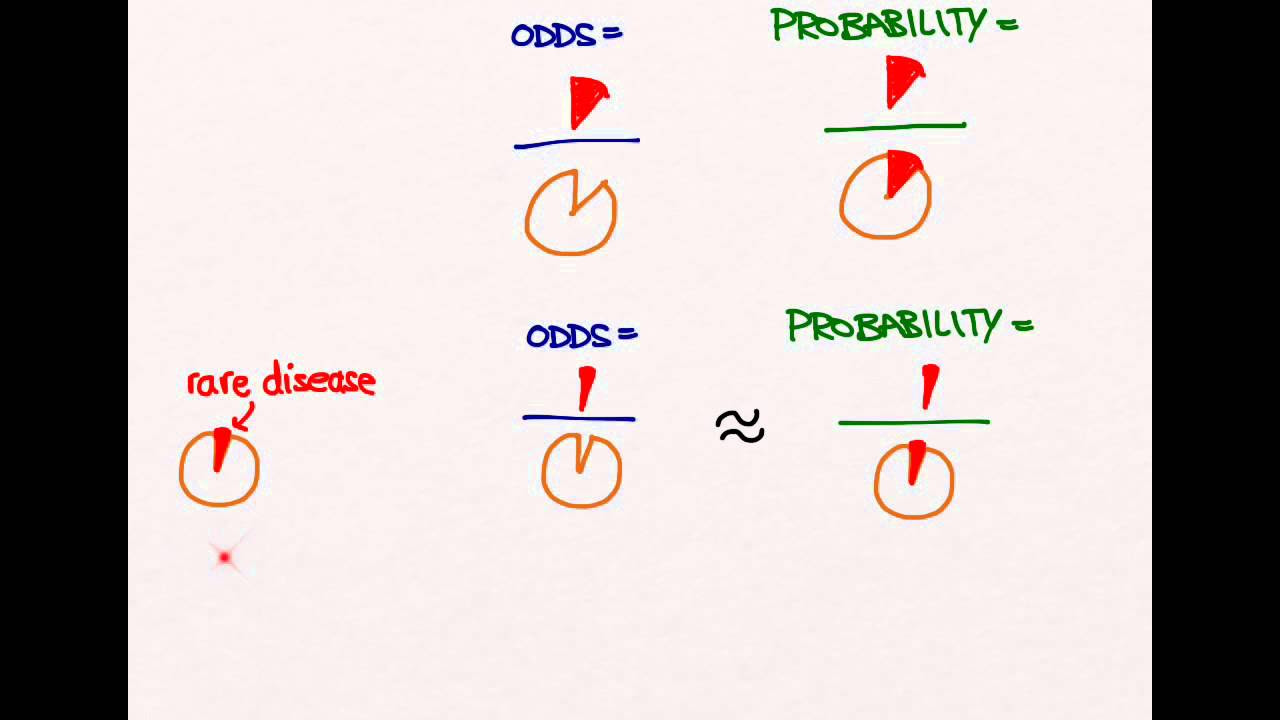
- 🎯 Odds Ratio is calculated by taking the odds of the exposed group (number of cases with the outcome divided by those without) and dividing it by the odds of the unexposed group.
- 🤔 The need for Odds Ratio arises in case-control studies where it's impractical to follow large populations over time to observe rare outcomes like lung cancer.
- 🏥 Case-control studies select cases (those with the outcome) and controls (those without), making it possible to calculate Odds Ratio but not Risk or Relative Risk directly from the data.
- 📊 In case-control studies, Odds Ratio can approximate Relative Risk for rare diseases, but this approximation fails when the disease is more common.
- 🧠 The video provides an example of a prospective study by Kerhan (2019) that used Relative Risk to show the association between hearing loss and cognitive decline in older patients.
- 🌐 Another example from Wrench's study (2020) used Odds Ratio in a case-control study to compare COVID-19 infection and mortality rates across different ethnicities.
- 📉 The chart provided in the video illustrates the relationship between Relative Risk and Odds Ratio, showing how they align for rare diseases but diverge for more common conditions.
- 👥 Adjusting for age and other variables in health statistics ensures that the comparison between exposure groups is fair and accounts for potential confounding factors.
- 🔍 Understanding the difference between Relative Risk and Odds Ratio is crucial for interpreting health statistics and making informed decisions in public health and clinical research.
Q & A
What is the main focus of the Health, Stats IQ video series?
-The main focus of the Health, Stats IQ video series is to explain critical concepts within health statistics.
What are relative risk and odds ratio, and why are they used in health sciences?
-Relative risk (RR) and odds ratio are measures of group comparison used when we have a categorical exposure and a categorical outcome. They help compare the probability of a negative outcome between two exposure groups, such as the risk of developing a disease or having a certain health condition.
How is a relative risk calculated?
-Relative risk is calculated by dividing the risk of the exposed group (e.g., those with a certain health condition or intervention) by the risk of the unexposed group (e.g., healthy controls or those without the condition).
What is the difference between a case-control study and a prospective study?
-A case-control study involves selecting participants based on the outcome of interest (cases) and a comparison group without the outcome (controls), then looking back to assess exposures. A prospective study follows participants forward in time from exposure to outcome, tracking the development of the condition of interest.
Why are odds ratios particularly useful in case-control studies?
-Odds ratios are useful in case-control studies because they provide a measure of association that is not affected by the sampling ratio of cases to controls, which is often not 1:1. This allows researchers to estimate the association between exposure and outcome even when the total number of participants in each group is not equal.
How does the odds ratio relate to the relative risk, especially in the context of rare diseases?
-In the context of rare diseases, the odds ratio is very close to the relative risk. This is because when the overall risk of developing the disease is low, the odds ratio mimics the relative risk, providing a similar measure of association.
What is the significance of the equivalence chart provided in the video?
-The equivalence chart helps to visualize the relationship between relative risk and odds ratio, showing how they compare when the risk of the unexposed group is at different levels. It highlights that while they are similar for rare diseases, the odds ratio can be significantly higher than the relative risk for more common diseases.
How does the video demonstrate the calculation of relative risks and odds ratios using examples?
-The video uses hypothetical examples, such as the relationship between BMI and stroke risk, and the association between city living and lung cancer risk, to demonstrate how to calculate relative risks and odds ratios. It provides numerical data and walks through the calculations step by step.
What is the practical application of relative risks and odds ratios in research?
-Relative risks and odds ratios are used in research to quantify the association between exposures and outcomes. For example, they can be used to assess the effect of hearing loss on cognitive decline or to compare the risk of testing positive for COVID-19 or dying from it across different ethnicities and age groups.
How can the concepts of relative risk and odds ratio be applied to improve clinical practice and public health?
-Understanding relative risk and odds ratio can help clinicians and public health professionals make informed decisions about interventions and policies. For instance, identifying factors that significantly increase the risk of disease can guide targeted prevention efforts, while understanding the odds ratios can help in designing case-control studies to investigate these associations.
What are the limitations of using odds ratios compared to relative risks?
-While odds ratios can be used in place of relative risks in case-control studies, they are not as intuitive and can sometimes be misleading when the outcome is not rare. The odds ratio can overestimate the relative risk when the outcome is more common, leading to potential misinterpretations of the data.
Outlines
📈 Introduction to Health Statistics and Relative Risk vs Odds Ratio
This paragraph introduces the video series on health statistics, focusing on the concepts of relative risk and odds ratio. It explains that these are measures of group comparison used with categorical exposure and outcomes, such as comparing intervention groups in health studies. The video aims to provide an intuitive understanding of these concepts through examples and discusses the relevance of these measures in research and statistics.
🧬 Understanding Relative Risk and Its Interpretation
This section delves into the concept of relative risk, explaining it as a measure of risk comparison between two groups with different exposures. It uses the example of obesity (BMI over 30) and its association with stroke risk to illustrate how relative risk is calculated and interpreted. The explanation emphasizes the intuitive nature of relative risk, showing how it can be used to compare the risk of an outcome between exposed and unexposed groups.
📊 Exploring Odds Ratios and Their Relevance in Case-Control Studies
This paragraph introduces odds ratios as another measure of group comparison, contrasting it with relative risk. It explains the concept of odds and how odds ratios are calculated, using the same obesity and stroke example to show the difference between risks and odds. The discussion highlights the importance of odds ratios in case-control studies, especially when prospective studies are impractical due to the rarity of outcomes like diseases.
🤔 Why Odds Ratios are Necessary and Their Calculation
The paragraph addresses the necessity of odds ratios in certain research scenarios, particularly when calculating risks and risk ratios is not feasible. It explains that odds ratios can be determined from case-control studies, which involve selecting individuals with and without a specific outcome and examining their exposure history. The explanation includes a formula for calculating odds ratios and emphasizes their applicability in studies where outcomes are rare.
📈 Equivalence of Relative Risk and Odds Ratio in Rare Diseases
This section discusses the relationship between relative risk and odds ratio, especially in the context of rare diseases. It presents a chart that illustrates how odds ratios closely mimic relative risks when diseases are rare. However, as the prevalence of the disease increases, the odds ratio begins to differ significantly from the relative risk. The explanation provides a clear understanding of when and why these two measures might yield similar or divergent results.
🧠 Application of Relative Risk and Odds Ratio in Research
The final paragraph provides real-world examples of how relative risks and odds ratios are applied in research. It references a study on hearing loss and cognitive decline, illustrating the use of relative risks, and another study examining COVID-19 experiences across different ethnicities, which used odds ratios. The discussion highlights the practical application of these statistical measures in understanding health outcomes and contributing to the field of health sciences.
Mindmap
Keywords
💡Relative Risk (RR)
💡Odds Ratio
💡Case-Control Studies
💡Prospective Study
💡Categorical Exposure
💡Categorical Outcome
💡Health Statistics
💡Epidemiology
💡Stroke
💡BMI (Body Mass Index)
💡Lung Cancer
Highlights
The video series is dedicated to critical concepts within health statistics, focusing on relative risk and odds ratio.
Relative risk (RR) and odds ratio are measures of group comparison used with categorical exposure and outcome.
An example is used to illustrate the calculation of relative risks and odds ratios, using BMI over 30 as the exposure and stroke as the outcome.
The video discusses the difference between prospective studies and case-control studies, and when odds ratios are particularly useful.
Odds ratios are necessary for case-control studies because they allow for the comparison of outcomes between exposed and unexposed groups without needing to know the total population.
The video presents a chart showing the equivalence between relative risks and odds ratios, particularly when diseases are rare.
In case-control studies, odds ratios can be used to infer the risk of developing a disease or condition based on exposure.
The video provides a real-world example of relative risks from a study on hearing loss and cognitive decline in older patients.
Another example from research is given, discussing a case-control study on COVID-19 and its impact on different ethnicities.
The video emphasizes the importance of understanding relative risk and odds ratios for clinicians, epidemiologists, and statisticians.
The presenter, Justin Zeltzer, encourages viewers to share the video series with others interested in health sciences.
The video series aims to provide an extensive look at health statistics, helping viewers better understand and apply these concepts.
A chart is introduced to show how particular relative risk values equate to odds ratios, providing a visual aid for understanding the relationship between the two.
The video explains why odds ratios are less interpretable and provide an extra layer of complexity, yet still essential in certain study designs.
The video discusses the limitations of calculating risks and risk ratios in case-control studies due to the selection of cases and controls.
The video provides a formula for calculating the odds ratio and explains why it is useful in the context of case-control studies.
Transcripts
Browse More Related Video
Odds Ratio, Relative Risk & Risk Difference with R | R Tutorial 4.11| MarinStatsLectures

Case-Control Study and Odds Ratio | Statistics Tutorial #31| MarinStatsLectures
Odds Ratios and Risk Ratios

Odds Ratio, Relative Risk, Risk Difference | Statistics Tutorial #30| MarinStatsLectures

Biostatistics SUMMARY STEP 1 - The Basics USMLE
Relative risk and risk ratios
5.0 / 5 (0 votes)
Thanks for rating: