Case-Control Study and Odds Ratio | Statistics Tutorial #31| MarinStatsLectures
TLDRThis video script delves into the rationale behind calculating the odds ratio in case-control studies. It explains the concept using a two-by-two table and clarifies why odds ratios are expressed as 'ad over BC'. The script emphasizes that in case-control designs, which are often used for rare diseases, we can't estimate disease prevalence but can determine the odds of exposure between diseased and non-diseased individuals. It concludes by highlighting that odds ratios are approximately equal to rate ratios for rare diseases, making them more intuitive to interpret.
Takeaways
- 📊 The odds ratio is calculated for case-control study designs using a 2x2 table format, where 'A' represents exposed cases with disease, 'B' exposed controls without disease, 'C' non-exposed cases with disease, and 'D' non-exposed controls without disease.
- 🧠 The odds ratio is defined as the odds of getting the disease given exposure (A/B) relative to the odds of the disease given no exposure (C/D), simplifying to the formula AD/BC.
- 🚫 The speaker expresses a preference against using the ABCD format for calculating odds ratios, finding it less intuitive compared to understanding the concept in terms of relative odds of exposure given disease status.
- 🔍 In a case-control study, prevalence estimates cannot be determined because the selection is based on disease status, thus making it impossible to estimate the probability of disease given exposure or no exposure.
- 🔄 However, the odds ratio can still be estimated in case-control studies by comparing the odds of exposure for those with the disease to the odds of exposure for those without the disease, which is mathematically equivalent to the odds ratio in a different context.
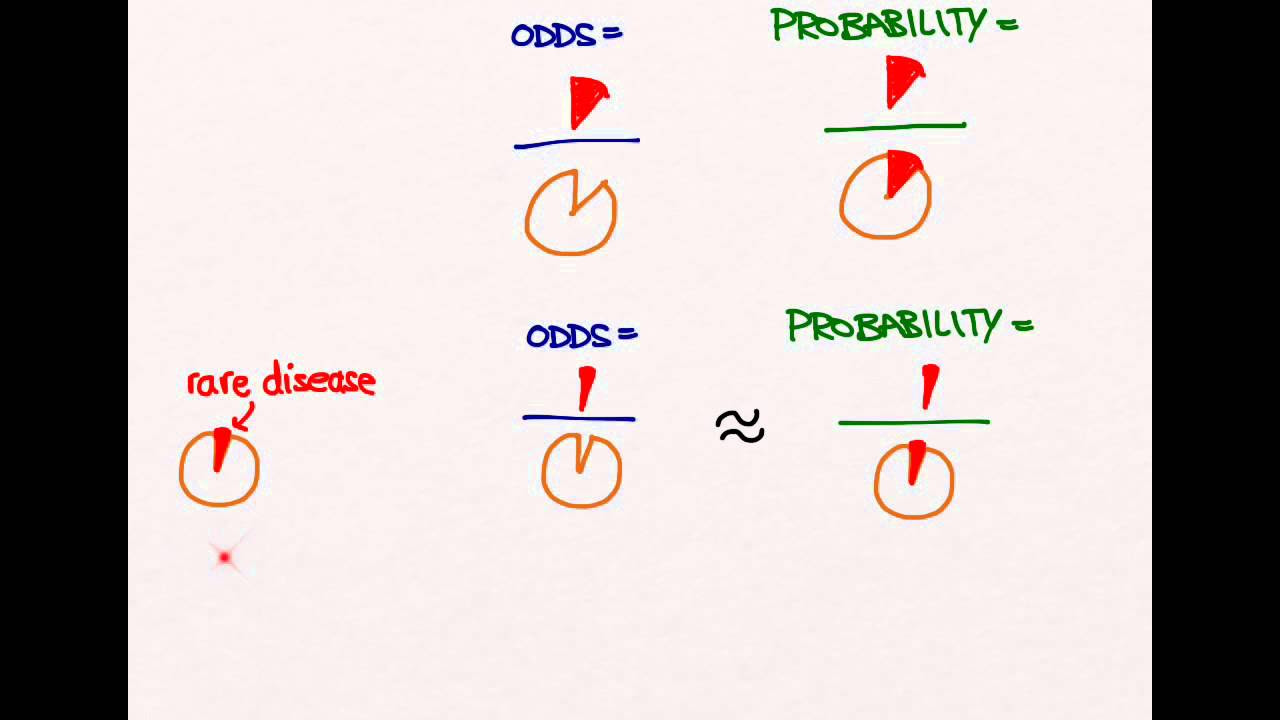
- 📈 The odds ratio (AD/BC) is particularly useful for rare diseases where it approximates the rate ratio, making it more intuitive to interpret.
- 🧪 Case-control studies are often used for rare diseases because cohort studies might not yield enough cases over time, so researchers select cases and controls and look back at exposures.
- 🌟 The video emphasizes the practical application of odds ratios in case-control studies, especially when dealing with rare diseases and the mathematical equivalence that simplifies the interpretation of results.
- 📝 The speaker also discusses the algebraic process of calculating odds ratios, highlighting the cancellation of terms that leads to the simplified formula.
- 🎯 The video is educational, aiming to clarify the use and interpretation of odds ratios in case-control study designs, particularly for viewers who may find the concept challenging.
- 📌 The transcript serves as a resource for understanding the nuances of odds ratios and their application in epidemiological research, especially in the context of rare diseases.
Q & A
Why is it appropriate to calculate an odds ratio for a case-control study design?
-In a case-control study, we select individuals based on their disease status and then inquire about their exposure. This design allows us to estimate the odds of exposure for those with the disease relative to those without, which is the odds ratio. It's a suitable measure because we are not estimating disease prevalence or probabilities directly, but rather the relationship between exposure and disease status.
What is the formula for calculating the odds ratio in a two-by-two table?
-The odds ratio is calculated as (ad)/(BC), where A represents the number of exposed cases, B represents the number of unexposed controls, C represents the number of unexposed cases, and D represents the number of exposed controls.
Why does the speaker prefer not to use the ABCD format for calculating odds ratios?
-The speaker prefers not to use the ABCD format because they find it less intuitive. Instead, they prefer to think of the odds ratio in terms of the odds of getting the disease for someone exposed relative to the odds for someone who's not exposed, which is a more conceptual understanding of the ratio.
What are the limitations when estimating probabilities in a case-control study design?
-In a case-control study, since individuals are selected based on their disease status, we cannot estimate the probability of having the disease given exposure or the probability of not having the disease given no exposure. This is because we have already selected the individuals based on their disease status, not their exposure status.
How does the odds ratio relate to the rate ratio for rare diseases?
-For rare diseases, the odds ratio is approximately equal to the rate ratio. This is because the prevalence of the disease is low, and the mathematical relationship between the odds of exposure given disease and the odds of disease given exposure becomes equivalent to the rate of exposure in the diseased group compared to the non-diseased group.
Why are case-control studies often used for rare diseases?
-Case-control studies are often used for rare diseases because in a cohort study, which follows people over time, there might not be enough cases of the disease to make meaningful statistical inferences. By selecting individuals based on their disease status and then looking back at their exposures, researchers can efficiently study the relationship between exposure and disease even when the disease is rare.
What is the two-by-two table in the context of a case-control study?
-The two-by-two table is a statistical table used in case-control studies to organize data based on exposure and disease status. It has four cells: A represents the number of exposed cases, B represents the number of unexposed controls, C represents the number of unexposed cases, and D represents the number of exposed controls.
How can we interpret the odds ratio in the context of a case-control study?
-In the context of a case-control study, the odds ratio can be interpreted as the odds of exposure for individuals with the disease compared to the odds of exposure for individuals without the disease. A ratio greater than 1 suggests that exposure is more common among those with the disease, while a ratio less than 1 suggests that exposure is less common among those with the disease.
What is the mathematical relationship between the odds of disease given exposure and the odds of disease given no exposure in a case-control study?
-In a case-control study, the mathematical relationship is such that the odds of disease given exposure (a/(a+b)) divided by the odds of disease given no exposure (c/(c+d)) is equal to the odds of exposure given disease (a/(c+a)) divided by the odds of exposure given no disease (b/(d+b)). This relationship allows us to estimate the odds ratio even though we cannot estimate disease prevalences.
How does the concept of odds relate to probabilities in the context of the odds ratio?
-Odds are a ratio of the probability of an event occurring to the probability of it not occurring. In the context of the odds ratio, it compares these ratios for two different groups (exposed and unexposed) to determine the relationship between exposure and disease.
What is the significance of the odds ratio being approximately equal to the rate ratio for rare diseases?
-The significance lies in the ease of interpretation. The rate ratio is a more intuitive measure for many people, as it directly compares the rates of exposure in the diseased and non-diseased groups. When the odds ratio approximates the rate ratio for rare diseases, it simplifies the interpretation of the results, making it easier for researchers and others to understand the relationship between exposure and disease risk.
Outlines
📊 Understanding Odds Ratio in Case-Control Studies
This paragraph explains the rationale behind calculating the odds ratio in case-control study designs. It begins by defining the odds ratio as the odds of getting a disease given exposure compared to the odds of the disease given no exposure. The explanation uses a conventional two-by-two table (ABCD format) to illustrate how odds ratios are derived. The paragraph emphasizes that while the odds ratio (ad/BC) is a common measure, it's more intuitive to think of it as the odds of exposure for those with the disease relative to those without. The discussion then shifts to the limitations of estimating prevalence in case-control studies, highlighting that while we cannot estimate the probability of disease given exposure, we can estimate the odds of exposure given disease status.
🧠 Interpreting Odds Ratio in Case-Control Studies
This paragraph delves into the interpretation of the odds ratio within the context of case-control studies. It clarifies that the odds ratio cannot estimate the probability of disease given exposure but can estimate the odds of exposure given disease status relative to the odds of exposure given no disease. The paragraph uses algebraic expressions to demonstrate how the odds of exposure given disease (a/(a+C)) and no disease (B/(B+D)) can be calculated. It concludes by noting that in case-control studies, which are often used for rare diseases, the odds ratio is approximately equal to the rate ratio, especially when the disease prevalence is less than 5%. This equivalence makes the odds ratio a more intuitive measure for interpreting the relationship between exposure and disease risk in such studies.
Mindmap
Keywords
💡Odds Ratio
💡Case-Control Study Design
💡Two-by-Two Table
💡Exposure
💡Disease
💡Probability
💡Algebra
💡Rate Ratio
💡Rare Diseases
💡Prevalence
💡Cohort Study
Highlights
Explaining why it's acceptable to calculate an odds ratio for a case-control study design.
Odds ratio is defined as the odds of getting the disease given exposure versus the odds of the disease given no exposure.
Using a conventional two-by-two table (ABCD format) to work out odds ratios, despite personal reservations.
The odds of disease given exposure can be calculated as the ratio of the probability of having the disease to not having it, given exposure.
The odds ratio formula is ad/BC, which is derived from the probabilities of disease and exposure.
In a case-control design, we select individuals based on disease status and then inquire about exposure, which affects the estimation of prevalence.
Case-control studies allow us to estimate the odds of exposure for someone with the disease relative to someone without the disease.
The odds of exposure given disease (a/C) is equal to the odds of exposure given no disease (B/D), which is a convenient mathematical outcome for case-control studies.
Odds ratio is approximately equal to the rate ratio for rare diseases, making it easier to interpret.
Case-control designs are commonly used for studying rare diseases because cohort studies might not yield enough cases over time.
The odds ratio is particularly useful in case-control studies as it provides a way to estimate the relationship between exposure and disease in rare conditions.
The video provides a clear and detailed explanation of how to calculate and interpret odds ratios in the context of case-control studies.
The presenter emphasizes the importance of understanding the mathematical equivalence of odds and rates in the context of rare diseases.
The video is aimed at viewers interested in epidemiological study designs and the statistical analysis of disease risk factors.
The presenter's approach to explaining odds ratios is both informative and accessible, making complex concepts easier to grasp.
The video concludes with an encouragement for viewers to subscribe and stay tuned for more educational content on similar topics.
Transcripts
Browse More Related Video


5.0 / 5 (0 votes)
Thanks for rating: