Medical Statistics - Part 4: Calculating Odds
TLDRThis ChalkTalk episode delves into the concepts of odds and risk, highlighting their differences and how each is calculated. It uses the example of a dice roll to introduce odds as a ratio of the likelihood of an event occurring versus not. The script further explains the distinction between risk (a proportion of the total group) and odds (a comparison of affected to unaffected individuals), emphasizing that while risk values are always between 0 and 1, odds can exceed 1. The episode also covers how to convert between risk and odds, noting that odds should not be expressed as percentages when they exceed 1.
Takeaways
- 🎲 Understanding Odds: Odds are calculated by dividing the probability of an event occurring by the probability of it not occurring.
- 📈 Probability vs Odds: Probability refers to the total number of events, while odds relate to the number of alternative events.
- 🚬 Lung Cancer Study: The risk of smokers developing lung cancer is calculated as the proportion of smokers with lung cancer from the total number of smokers.
- 🔢 Odds Calculation: The odds of smokers developing lung cancer are calculated by dividing the number of smokers with lung cancer by those without.
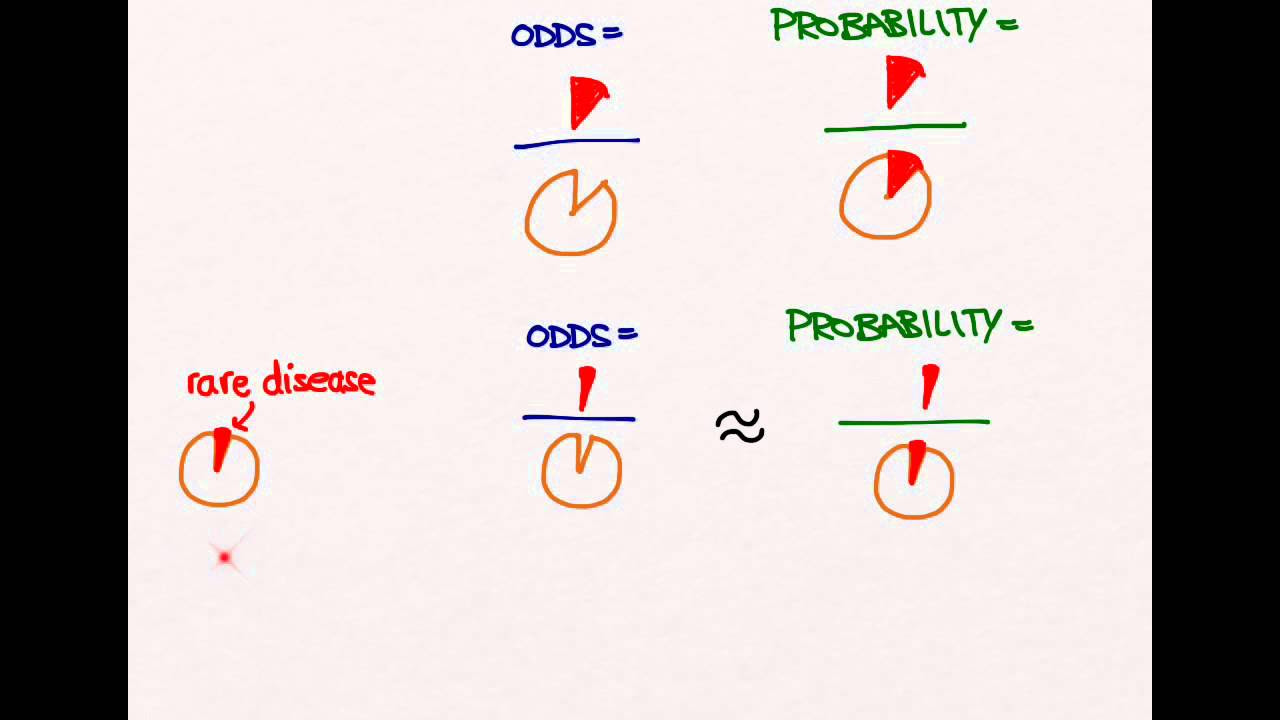
- 🍰 Pie Chart Analogy: Risk is represented as a slice of cake divided by the entire cake, while odds are the slice divided by the remaining cake.
- 📊 Risk and Odds Distinction: The difference between risk and odds lies in the denominator of the fraction, representing the comparative value.
- 📈 Extreme Cases: When a disease is very common in the examined group, the difference between risk and odds values can be significant.
- 📌 Risk Range: Risk is a proportion and cannot exceed the value of 1, making it always between 0 and 1.
- 🔄 Odds Exceeding 1: Unlike risk, odds can exceed 1 if the number of individuals with the disease is higher than those without.
- 💡 Expressing Odds: Odds are not expressed as percentages as they are not proportions, but rather a comparison between individuals with and without the disease.
- 🔄 Conversion Formula: Risk and odds values can be converted using the formula: odds = risk / (1 - risk).
Q & A
What is the basic concept of odds?
-Odds represent a way of showing how often an event occurs, calculated by dividing the probability of an event occurring by the probability of it not occurring.
How do you calculate the odds of rolling a six in a dice game?
-The odds of rolling a six are calculated by dividing the number of favorable outcomes (1) by the number of unfavorable outcomes (5), resulting in 1 to 5 or 0.2.
What is the difference between risk and odds?
-Risk is the proportion of a specific event occurring within a group, while odds relate to the ratio of the number of outcomes with the event to those without. Risk cannot exceed 1, whereas odds can exceed 1 if there are more occurrences of the event than non-occurrences.
How is the risk of smokers developing lung cancer calculated in the study?
-The risk is calculated as the proportion of smokers with lung cancer (20) to the total number of smokers (100), which is 20 divided by 100, resulting in a risk of 0.2 or 20%.
What are the odds of smokers developing lung cancer based on the study?
-The odds are calculated by dividing the number of smokers with lung cancer (20) by the number of smokers without lung cancer (80), resulting in odds of 0.25 or 25%.
How can you convert risk values to odds values?
-To convert risk to odds, divide the risk value by 1 minus the risk value. For example, a risk of 0.2 would be converted to odds by calculating 0.2 divided by (1 - 0.2), which equals 0.25.
Why can't odds values be expressed as percentages?
-Odds values cannot be expressed as percentages because they are not proportions but rather a ratio comparing individuals with and without the event. Expressing odds as a percentage would not accurately represent the relationship between the two groups.
What happens to the difference between risk and odds values as the prevalence of a disease increases?
-As the prevalence of a disease increases, the difference between risk and odds values becomes larger. This is because odds can exceed 1 when there are more occurrences of the event, while risk remains between 0 and 1 as a proportion.
How can you describe the risk of smokers in the study using a pie chart analogy?
-In the pie chart analogy, the risk of smokers can be described as a slice of cake (representing the 20 smokers with lung cancer) divided by the entire cake (representing all 100 smokers).
What is the relationship between risk and odds values for rare diseases?
-For rare diseases, the risk and odds values are quite similar because the number of individuals with the disease is small relative to the number without, leading to a smaller difference between the two values.
How can you express the risk of smokers developing lung cancer as a percentage?
-The risk can be expressed as a percentage by interpreting it as the proportion of individuals with the disease out of the total number of individuals. In the example, the risk of 0.2 corresponds to 20%.
What would be the new risk and odds values if 99 out of 100 smokers developed lung cancer?
-The new risk value would be 99 divided by 100, which is 0.99 or 99%. The new odds value would be 99 divided by 1, which is 99, as there is only one smoker without lung cancer.
Outlines
🎲 Understanding Odds and Risk
This paragraph introduces the concept of odds and differentiates it from risk. It explains how odds are calculated by dividing the probability of an event occurring by the probability of it not occurring, using the example of rolling a six on a dice. The paragraph also clarifies the distinction between probability, which relates to the total number of events, and odds, which relate to the number of alternative events. It further illustrates this with a study on lung cancer among smokers, showing how risk and odds are calculated and highlighting the difference in their comparative values. The use of a pie chart analogy helps to visualize the calculation of risk and odds, emphasizing that while risk is always a value between 0 and 1, odds can exceed 1 if the number of individuals with the disease is higher than those without it.
📈 Converting Risk and Odds
This paragraph discusses the convertibility of risk and odds values, explaining how odds can be calculated from risk and vice versa. It emphasizes that odds are not proportions and therefore cannot be expressed as percentages, unlike risk. The paragraph provides a formula for converting the odds of developing a disease from the risk, which is the risk divided by 1 minus the risk. The summary also reiterates the key points from the previous discussion on how the risk and odds values are calculated and how they relate to the prevalence of the disease in the group examined. The paragraph concludes with a clear distinction that while risk values are always between 0 and 1, odds can exceed 1, and that odds should not be incorrectly expressed as percentages.
Mindmap
Keywords
💡Odds
💡Probability
💡Risk
💡Relative Risk
💡Exposure
💡Outcome
💡Denominator
💡Conversion
💡Pie Chart
💡Percentage
💡Disease Prevalence
Highlights
The concept of odds and how to calculate them is explained in this transcript.
Odds are calculated by dividing the probability of an event occurring by the probability of it not occurring.
Probability and odds are different; probability refers to the total number of events, while odds relate to the number of alternative events.
An example is given where rolling a six on a dice has a probability of 1 out of 6, but the odds are 1 to 5.
Risk and odds are compared using a study on lung cancer among smokers, showing how they can differ.
The risk of smokers developing lung cancer is calculated as 20 out of 100, or 0.2.
The odds of smokers developing lung cancer are calculated as 20 divided by 80, which is 0.25.
A pie chart analogy is used to explain the difference between risk and odds, with risk being a slice of cake divided by the whole cake, and odds being a slice divided by the remaining cake.
For rare diseases, risk and odds values are quite similar, but the more common the disease, the larger the difference between the two values.
Risk values cannot exceed 1 and are always between 0 and 1, as they are proportions.
Odds values can exceed 1 if the number of individuals with the disease is higher than those without.
Risk can be expressed as a percentage, but odds cannot, as they are not proportions.
The formula to convert risk to odds is provided, which is odds = risk / (1 - risk).
A summary of the key points about odds is provided, emphasizing the difference between risk and odds in the context of disease prevalence.
The importance of understanding the distinction between risk and odds in statistical analysis is highlighted.
The transcript is part of the ChalkTalk series on statistics, aiming to educate on statistical concepts.
The practical application of calculating odds is demonstrated through the example of a dice game and a hypothetical lung cancer study.
The transcript provides a clear and accessible explanation of how odds and risk are used in the context of health studies.
Transcripts
Browse More Related Video
Risk, Rate and Odds
Relative Risk vs Odds Ratio! EXTENSIVE VIDEO!
Odds Ratios and Risk Ratios
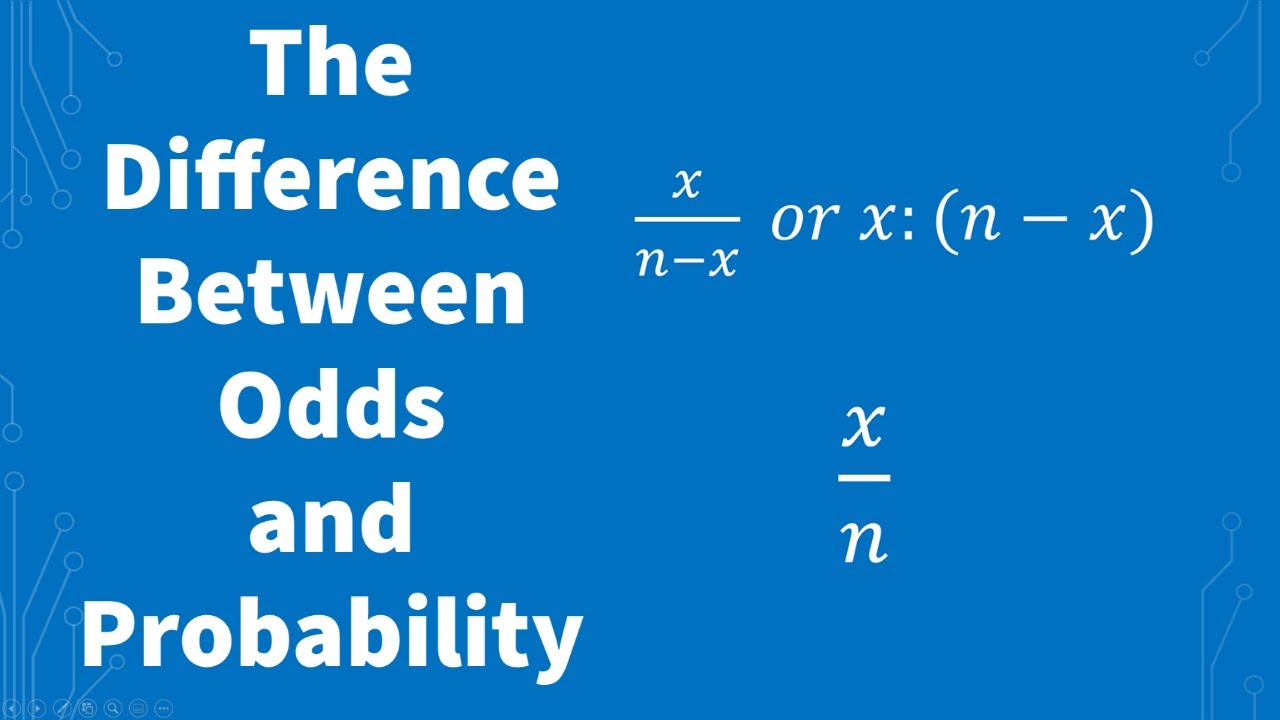
What Is The Difference Between Odds and Probability? | Statistics

Case-Control Study and Odds Ratio | Statistics Tutorial #31| MarinStatsLectures
4.1.5 Basics of Probability - Odds and Their Relation to Probability
5.0 / 5 (0 votes)
Thanks for rating: