Isoclines: A Way to Analyze Slope Fields
TLDRThis video script delves into the concept of slope fields and isoclines in the context of first-order differential equations. The instructor explains that 'iso' means same and 'klein' refers to slope, focusing on identifying locations in the slope field with constant slope. By examining a straightforward differential equation, the video emphasizes understanding the big picture without immediate reliance on computational tools. It illustrates how to sketch slope fields by determining areas of positive, negative, and zero slopes, using circles of varying radii as visual guides. The script concludes with a brief demonstration of using a computer software, D Field, to graph the phase plane and visualize the slope field, reinforcing the idea that isoclines are curves of constant slope.
Takeaways
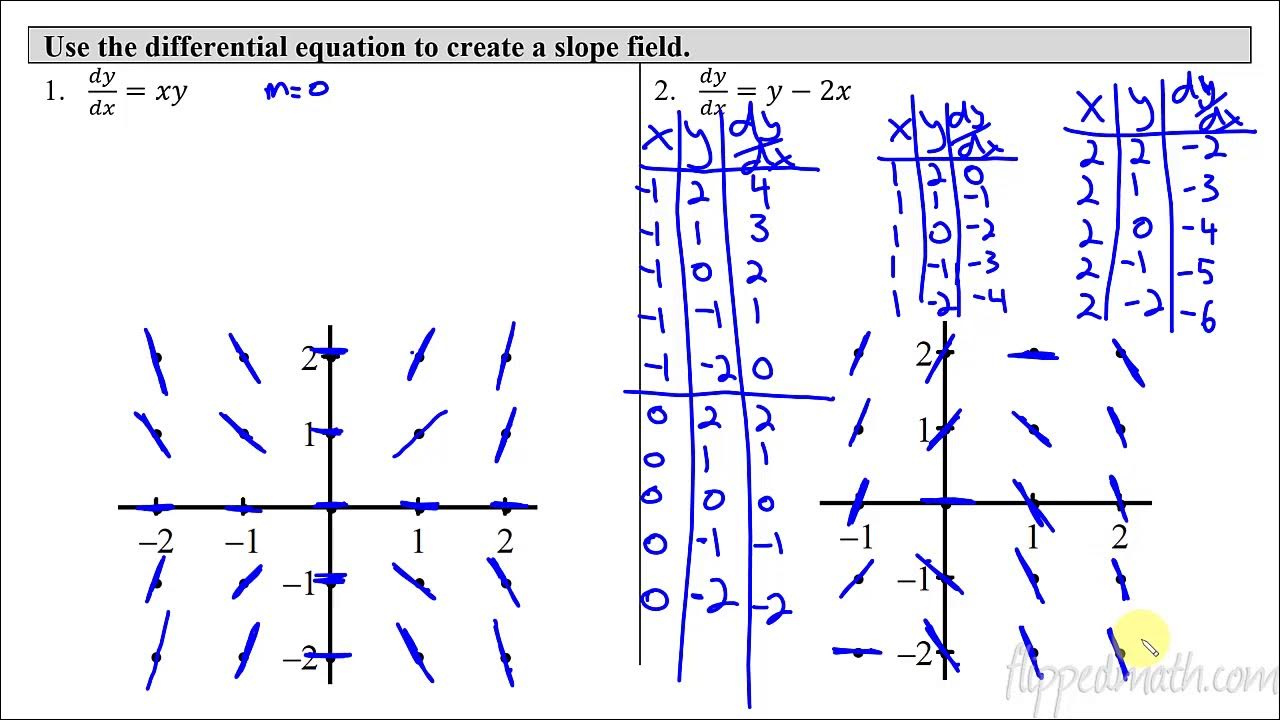
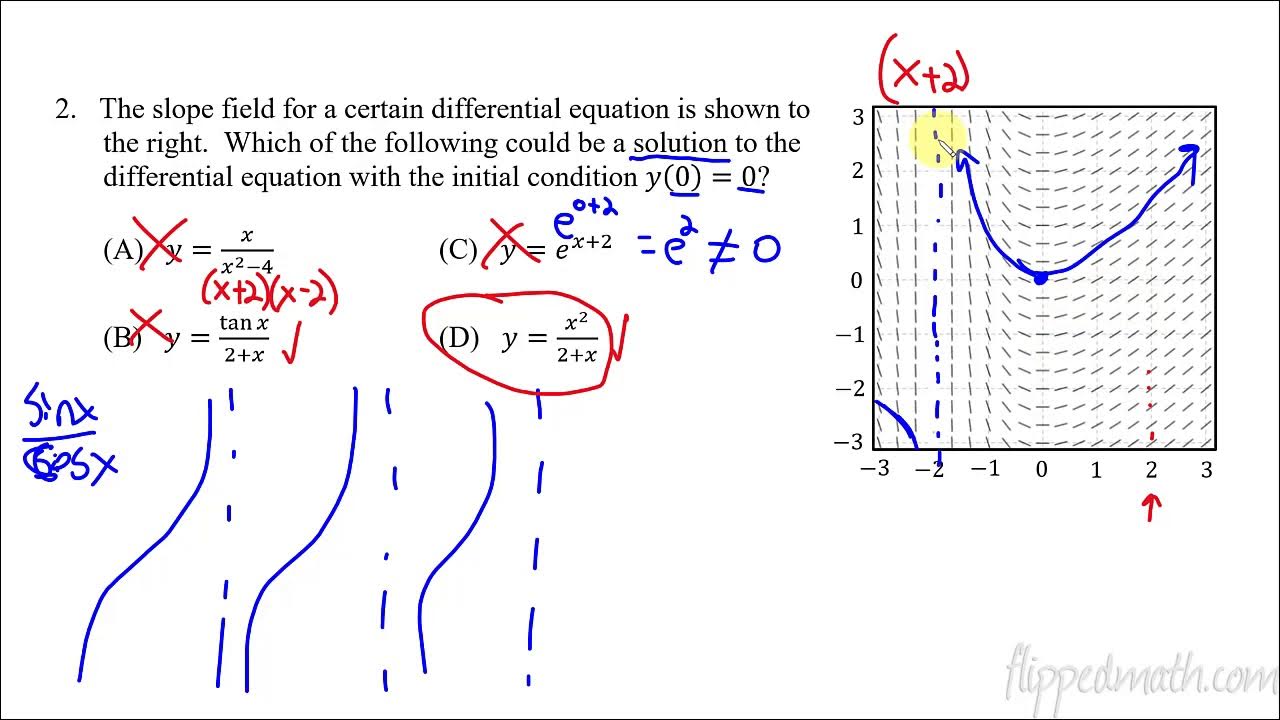
- 📈 The concept of slope fields was discussed, emphasizing the importance of isoclines.
- 🌐 'Iso' means same and 'klein' means slope, referring to constant slopes in the field.
- 🔢 A first-order differential equation was provided as an example to illustrate the concept.
- 🖌️ The process of analyzing the slope field without a computer was outlined, focusing on a big-picture understanding.
- 📊 The video included a comparison between hand-drawn and computer-graphic representations of the slope field.
- ⭕️ A circle of radius √2 centered at the origin represents points of slope 0 in the slope field.
- 🔼 The circle of radius √3 centered at the origin represents points of positive slope 1.
- 🔽 A circle of radius 1 centered at the origin represents points of negative slope -1.
- 🔄 The video demonstrated how to adjust settings in a software called d field to visualize the slope field.
- 📝 The importance of identifying positive, negative, and zero slopes to understand the overall structure of the slope field was highlighted.
- 🎯 The term 'isocline' was explained as the curve along which the slope is a particular constant value.
Q & A
What is the main focus of the video?
-The main focus of the video is to discuss slope fields and isoclines in the context of first-order differential equations, emphasizing understanding the big picture without necessarily using a computer for graphing.
What does the term 'iso' mean?
-The term 'iso' means 'same', which in the context of the video refers to the constant value of the slope in isoclines.
What does the term 'klein' mean in the context of the video?
-In the context of the video, 'klein' is a mispronunciation of 'cline', which refers to lines of constant slope in a slope field.
How does the speaker suggest to visualize the slope field?
-The speaker suggests visualizing the slope field by identifying the locations where the slope is zero, positive, and negative, and then sketching circles with different radii and slopes to get a big picture visualization of the slope field.
What is the significance of the circle with a radius of √2 centered at the origin?
-The circle with a radius of √2 centered at the origin represents the points in the slope field where the slope is zero, indicating horizontal tangent lines to the curve.
How does the speaker describe the slope one isocline?
-The speaker describes the slope one isocline as a circle with a radius of √3 centered at the origin, where the tangent lines have a slope of one, forming 45-degree angles with the coordinate axes.
What is the significance of the circle with a radius of 1 centered at the origin?
-The circle with a radius of 1 centered at the origin represents the points in the slope field where the slope is negative one, with tangent lines forming negative 45-degree angles with the coordinate axes.
What is the main purpose of isoclines?
-The main purpose of isoclines is to identify the curves along which the slope of the differential equation is constant, helping to understand the behavior of the solutions without having to plot the entire slope field.
How does the speaker change the default settings in D Field to match the example?
-The speaker changes the default settings by replacing 'x as a function of t' with 'y as a function of x', and adjusts the independent variable to x. They also modify the equation to fit the form of the example and adjust the window settings to better visualize the slope field.
What numerical approximations can be seen in the slope field graphed on the computer?
-In the slope field graphed on the computer, numerical approximations for the solution curves can be seen by clicking anywhere in the graph, which helps to visualize the solutions of the differential equation.
Outlines
📈 Introduction to Slope Fields and Isoclines
This paragraph introduces the concept of slope fields and isoclines, emphasizing the importance of understanding constant slopes within these fields. The speaker begins by defining the term 'isocline' and its relation to the slope of a function. They then present a first-order differential equation and discuss the approach to identifying points in the graph where the slope (dy/dx) is constant. The speaker also explains how to visualize these points by setting the right-hand side of the equation to a constant value, resulting in circles with specific radii and centers. The paragraph concludes with a brief mention of how to sketch these circles and understand the areas of positive, negative, and zero slopes.
🖥️ Using D-Field to Visualize Slope Fields and Isoclines
In this paragraph, the speaker continues the discussion on slope fields and isoclines by introducing the use of D-Field, a computational tool for visualizing these concepts. They explain the process of adjusting the settings in D-Field to match the differential equation being discussed, which involves changing the independent variable and the form of the equation. The speaker then demonstrates how to graph the phase plane and interpret the visual representation of the slope field, including the identification of isoclines as curves of constant slope. The paragraph emphasizes the importance of understanding positive, negative, and zero slopes and how to use these insights to analyze the slope field effectively.
Mindmap
Keywords
💡slope field
💡isoclines
💡first-order differential equation
💡dy/dx
💡circle of radius square root of 2
💡positive slope
💡negative slope
💡DField
💡tangent lines
💡phase plane
Highlights
The introduction of slope fields and isoclines, emphasizing the concept of iso meaning 'same' and klein meaning 'slope'.
The explanation of the first order differential equation and its relation to the slope field.
The method of visualizing the slope field without a computer by considering constant slopes and their corresponding values (positive, negative, and zero).
The identification of the circle of radius square root of 2 centered at the origin as the location of zero slope in the slope field.
The description of positive slope as areas where the rise and run are equal, forming 45-degree angles with the coordinate axes.
The illustration of the circle of radius square root of 3 to represent areas of positive slope one in the slope field.
The explanation of negative slope as areas with 45-degree angles to the coordinate axes but in the opposite direction, representing a slope of negative one.
The use of the term 'isocline' to describe curves along which the slope is constant, and the clarification of its meaning.
The demonstration of how to use the d field software to visualize the overall slope field and its parameters.
The caution about changing the default settings in d field to match the specific differential equation being used.
The process of adjusting the window settings in d field to better visualize the phase plane.
The observation of numerical approximations for solution curves within the d field visualization.
The strategy of starting with positive, negative, and zero slopes when looking for isoclines if no specific constants are given.
The emphasis on understanding the big picture of slope fields and the distribution of different slope values.
The practical approach to sketching isoclines and the importance of understanding their role in the slope field.
The discussion on how to interpret the differential equation and its implications for the slope field.
The application of the concept of isoclines to homework problems and their relevance to understanding slope fields.
Transcripts
5.0 / 5 (0 votes)
Thanks for rating:


