Using the Empirical rule to determine the approximate percentage of data less than a given value
TLDRThe video script discusses the application of the empirical rule to determine the percentage of women shorter than 59 inches, given a normal distribution with a mean height of 64 inches and a standard deviation of 2.5 inches. It explains the concept of a bell curve and how to use the empirical rule to approximate the percentage of women below two standard deviations from the mean. The script also illustrates the process of calculating the area under the curve and concludes that approximately 2.5% of women are shorter than 59 inches.
Takeaways
- 📊 The script discusses the normal distribution of women's heights, with an average of 64 inches and a standard deviation of 2.5 inches.
- 📈 The problem involves finding the percentage of women shorter than 59 inches using the empirical rule, which is applicable to normally distributed data.
- 📝 The speaker underlines the importance of recognizing the 'normally distributed' and 'approximately what percentage' phrases as indicators for using the empirical rule.
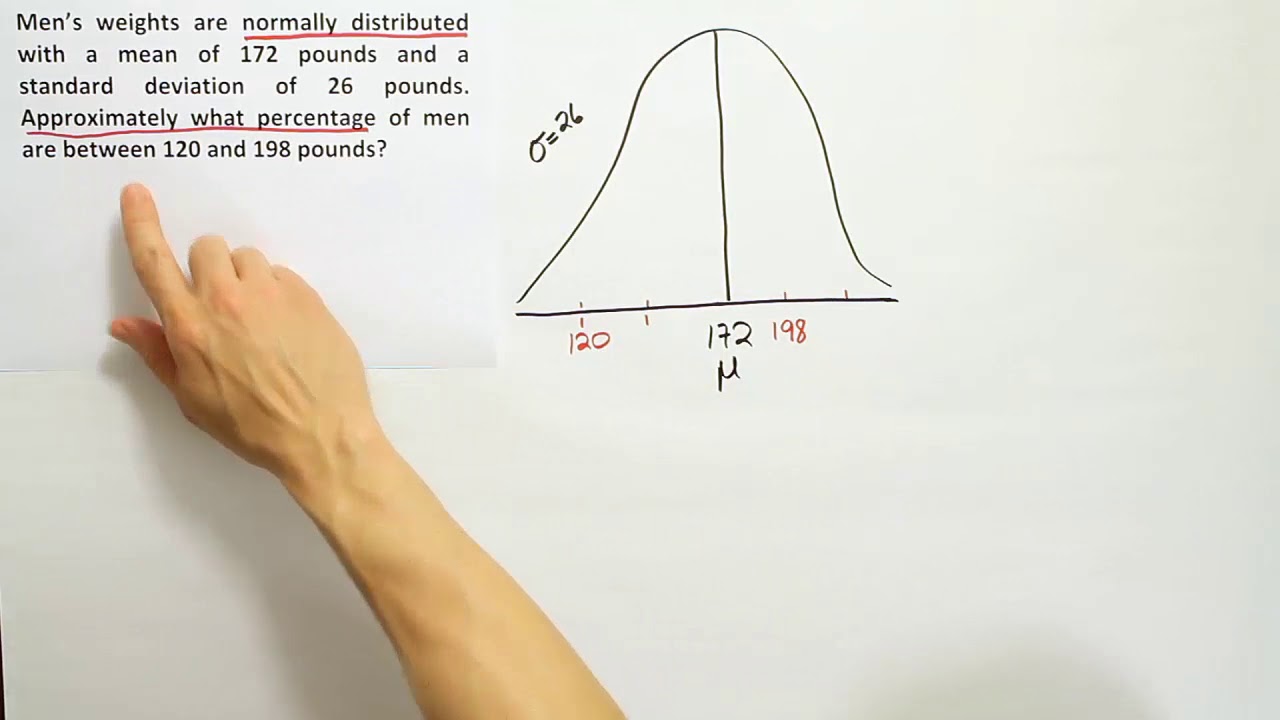
- 📐 The script suggests visualizing the problem by drawing a bell curve and labeling the mean and standard deviation.
- 🔢 The height of 59 inches is identified as being two standard deviations below the mean, which is calculated by subtracting the mean and dividing by the standard deviation.
- 📉 The empirical rule states that approximately 95% of the data falls within two standard deviations of the mean, which is used to estimate the percentage of women shorter than 59 inches.
- 🤔 The speaker explains that since 59 inches is two standard deviations below the mean, we need to consider the area outside this range to find the percentage of women shorter than this height.
- 🧩 The script breaks down the problem by considering the symmetry of the bell curve and the proportion of the area that represents 95% of the data.
- 📌 The final calculation involves determining the area that is less than 59 inches, which is found by subtracting 47.5% (half of 95%) from 50%, resulting in 2.5%.
- 📝 The script emphasizes the importance of drawing and visualizing the problem to understand the distribution and calculate the percentage accurately.
- 🔑 The key takeaway is that approximately 2.5% of women are shorter than 59 inches, based on the empirical rule and the normal distribution of heights.
Q & A
What is the average height of women according to the script?
-The average height of women is 64 inches.
What is the standard deviation of women's heights in the script?
-The standard deviation of women's heights is 2.5 inches.
What height is being considered in the script to determine the percentage of women shorter than it?
-The height being considered is 59 inches.
What does the script suggest about the distribution of women's heights?
-The script suggests that women's heights are normally distributed, forming a bell curve.
What statistical rule is being referred to as 'the empirical rule' in the script?
-The empirical rule, also known as the 68-95-99.7 rule, is being referred to in the script.
What does the empirical rule state about the distribution of data within one standard deviation of the mean?
-The empirical rule states that approximately 68% of the data falls within one standard deviation of the mean.
According to the script, how much of the data is captured within two standard deviations of the mean?
-Within two standard deviations of the mean, approximately 95% of the data is captured.
What percentage of women are shorter than 59 inches according to the script's application of the empirical rule?
-According to the script, approximately 2.5% of women are shorter than 59 inches.
How does the script determine that 59 inches is two standard deviations below the mean height of women?
-The script subtracts the mean height (64 inches) from 59 inches, resulting in -5, and then divides by the standard deviation (2.5 inches), indicating two standard deviations below the mean.
What is the significance of the negative result when calculating the number of standard deviations below the mean in the script?
-The negative result signifies that the height in question (59 inches) is below the average height, but the absolute value is used for the calculation.
How does the script conclude that the percentage of women shorter than 59 inches is 2.5%?
-The script concludes this by understanding that the area outside of two standard deviations (which captures 95% of the data) is split symmetrically into two tails, each containing 2.5% of the data.
Outlines
📊 Understanding Normal Distribution and Empirical Rule
This paragraph introduces a statistical problem involving the normal distribution of women's heights. The average height is given as 64 inches with a standard deviation of 2.5 inches. The task is to find the percentage of women shorter than 59 inches. Key phrases like 'normally distributed' and 'approximately what percentage' suggest the use of the empirical rule, which applies to bell-shaped distributions. The speaker emphasizes the importance of visualizing the data with a bell curve and identifying the position of 59 inches relative to the mean. The explanation includes calculating the number of standard deviations away from the mean by using the formula (X - μ) / σ, where X is the value in question, μ is the mean, and σ is the standard deviation. The result indicates that 59 inches is two standard deviations below the mean.
📈 Applying the Empirical Rule to Find the Percentage of Women Shorter Than 59 Inches
The second paragraph delves into applying the empirical rule to determine the percentage of women with heights less than 59 inches. The empirical rule states that approximately 68% of data falls within one standard deviation of the mean, 95% within two standard deviations, and 99.7% within three standard deviations. The speaker uses this rule to deduce that since 59 inches is two standard deviations below the mean, the percentage of women this height or shorter can be found by calculating the area in the tail of the distribution. The explanation involves understanding the symmetry of the bell curve and calculating the remaining percentage outside the 95% interval, which is 5%. This is then split equally between the two tails, resulting in 2.5% in each tail. The final step is to subtract this 2.5% from 50% (the total area under one side of the curve) to find that approximately 2.5% of women are shorter than 59 inches.
Mindmap
Keywords
💡Normal Distribution
💡Average Height
💡Standard Deviation
💡Empirical Rule
💡Percentage
💡Bell Curve
💡Chebyshev's Theorem
💡Symmetric
💡Mean and Standard Deviation
💡K Value
Highlights
The problem involves a normally distributed variable, specifically women's heights, with an average of 64 inches.
The standard deviation for women's heights is approximately 2.5 inches.
The task is to determine the percentage of women shorter than 59 inches, which is two standard deviations below the mean.
The concept of the empirical rule is introduced for approximating the percentage within a normal distribution.
A bell curve is drawn to visualize the distribution and the problem's parameters.
The mean (64 inches) and standard deviation (2.5 inches) are labeled on the bell curve.
The height of 59 inches is placed on the curve to identify its position relative to the mean.
The calculation of how many standard deviations 59 inches is from the mean is explained.
The concept of Chebyshev's theorem is contrasted with the empirical rule for approximating percentages.
The empirical rule states that approximately 68% of data falls within one standard deviation of the mean, 95% within two, and 99.7% within three.
A method to calculate the percentage of women shorter than 59 inches using the empirical rule is described.
The calculation involves determining the area under the curve that represents the percentage of women below 59 inches.
The solution involves understanding the symmetry of the bell curve and the distribution of percentages on either side of the mean.
The final solution is approximated to be 2.5% of women being shorter than 59 inches.
The importance of visualizing the problem with a bell curve drawing is emphasized for clarity.
The transcript provides a step-by-step guide on how to approach problems involving normal distributions and the empirical rule.
The process of reasoning through the problem is detailed, including the use of standard deviation markers on the bell curve.
The transcript concludes with a recap of the reasoning and the final answer, reinforcing the learning process.
Transcripts
Browse More Related Video
Math 14 6.2.25 Find the percentage of women meeting the height requirement.

Math 14 HW 6.4.15-T Using the Central Limit Theorem
Applying the empirical rule to an example that uses an interval that is not symmetric
Empirical Rule 68-95-99.7 Rule to Find Percentile
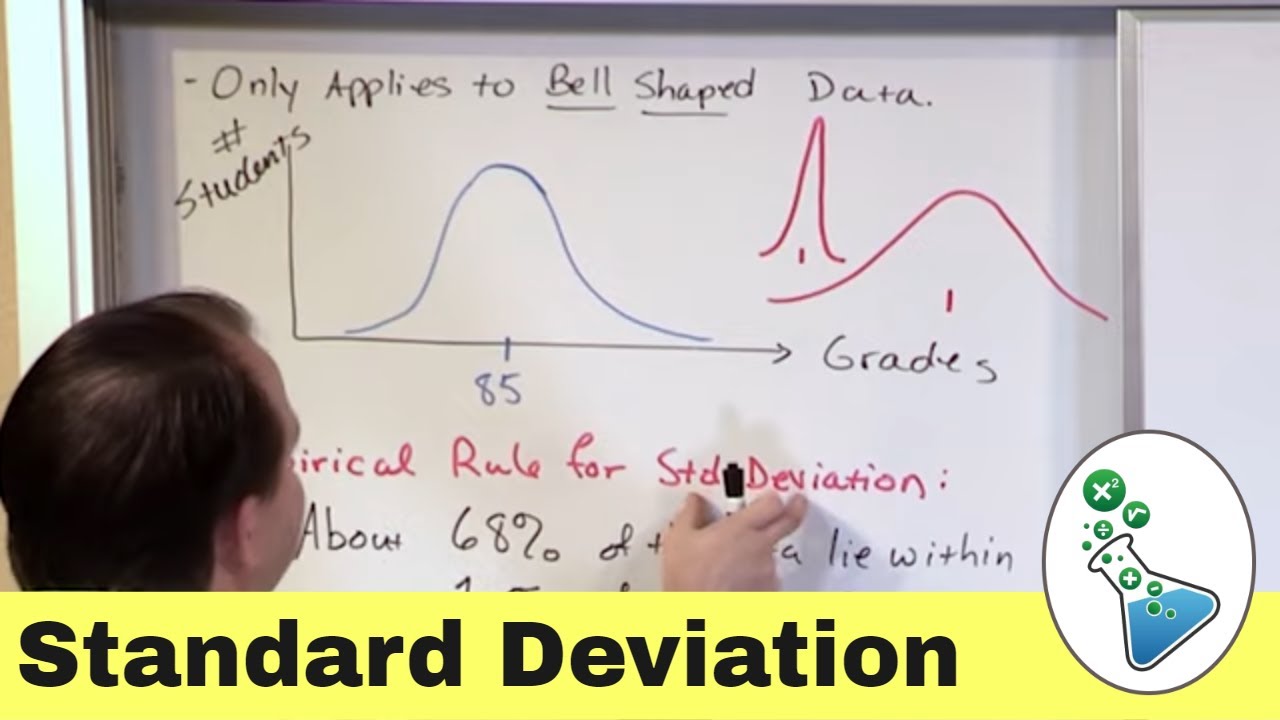
Empirical Rule of Standard Deviation in Statistics
Statistics Lecture 3.3: Finding the Standard Deviation of a Data Set
5.0 / 5 (0 votes)
Thanks for rating: