Increasing and Decreasing Functions and the First Derivative Test
TLDRThis educational video explains the concept of increasing and decreasing functions using the first derivative test. It covers definitions, tests for increasing and decreasing intervals, and how to identify relative maxima and minima. The video includes examples with detailed steps to find critical points, determine intervals of increase/decrease, and sketch graphs accordingly.
Takeaways
- 📈 The concept of increasing and decreasing functions is introduced through the first derivative test, which uses the sign of the derivative to determine the behavior of a function.
- 🔍 A function is considered increasing on an interval if for any two points \( x_1 < x_2 \), \( f(x_1) < f(x_2) \), indicating the function's value is rising as \( x \) increases.
- 🔻 Conversely, a function is decreasing if \( f(x_1) > f(x_2) \) for \( x_1 < x_2 \), showing the function's value falls as \( x \) increases.
- 📚 The first derivative test states that if \( f'(x) \) is positive over an interval, the function is increasing, and if \( f'(x) \) is negative, the function is decreasing.
- 🔍 Critical points are identified where the derivative is zero or undefined, which can indicate potential relative maxima or minima.
- 📉 If \( f'(x) \) changes from negative to positive at a critical point, it indicates a relative minimum for the function.
- 📈 If \( f'(x) \) changes from positive to negative at a critical point, it indicates a relative maximum for the function.
- 📊 The process involves finding the first derivative of the function, setting it to zero to find critical points, and analyzing the sign of the derivative around these points.
- 📐 The sign chart is a useful tool for organizing thoughts and determining the intervals of increase and decrease, as well as identifying relative maxima and minima.
- 🎨 Sketching the graph of the function based on the first derivative test results helps visualize the function's behavior, including its maxima, minima, and intervals of increase and decrease.
- 🤔 The presence of undefined derivatives at critical points can indicate sharp turns in the graph, which are not typical maxima or minima but rather points of discontinuity in the derivative.
- 📝 The script concludes with the importance of practicing these concepts to solidify understanding and prepare for further mathematical analysis.
Q & A
What is the definition of an increasing function on an interval?
-A function is increasing on an interval if for any two numbers x1 and x2 within that interval, where x1 is less than x2, the function values satisfy f(x1) < f(x2), meaning the y-coordinates get larger as you move from left to right.
What is the definition of a decreasing function on an interval?
-A function is decreasing on an interval if for any two numbers x1 and x2 within that interval, where x1 is less than x2, the function values satisfy f(x1) > f(x2), meaning the y-coordinates get smaller as you move from left to right.
How does the first derivative test determine if a function is increasing on a closed interval?
-If the derivative (f') is positive for all x in the open interval from A to B, then the function is said to be increasing on the closed interval [A, B].
How does the first derivative test determine if a function is decreasing on a closed interval?
-If the derivative (f') is negative for all x in the open interval from A to B, then the function is said to be decreasing on the closed interval [A, B].
What does it mean if the derivative of a function is zero for all x in an interval?
-If the derivative (f') is zero for all x in an interval, it indicates that the function is constant on that interval, meaning it is neither increasing nor decreasing.
What is a critical point in the context of the first derivative test?
-A critical point is a value of x where the derivative of the function changes sign or is undefined. These points are potential locations for relative maxima or minima.
How does the change in the sign of the derivative indicate a relative maximum or minimum?
-If the derivative changes from negative to positive at a critical point, it indicates a relative minimum. If it changes from positive to negative, it indicates a relative maximum.
What is the first derivative of the function f(x) = x^2 - 2x - 3?
-The first derivative of the function f(x) = x^2 - 2x - 3 is f'(x) = 2x - 2.
How can you find the critical points of the function f(x) = x^2 - 2x - 3?
-To find the critical points, set the first derivative equal to zero: 2x - 2 = 0, which gives x = 1. This is the critical point.
What are the intervals where the function f(x) = x^2 - 2x - 3 is increasing and decreasing?
-The function f(x) = x^2 - 2x - 3 is increasing on the intervals (-∞, 1) and (1, ∞), and decreasing on the interval (1, ∞). Note that the interval should be (1, ∞) for decreasing, as the function changes from decreasing to increasing at x = 1.
What are the relative maximum and minimum points of the function f(x) = x^2 - 2x - 3?
-The relative maximum and minimum points of the function f(x) = x^2 - 2x - 3 occur at x = 1, where the function changes from decreasing to increasing.
How can you sketch a graph of a function based on its increasing and decreasing intervals and critical points?
-To sketch a graph, plot the critical points and mark the intervals where the function is increasing and decreasing. Draw the curve accordingly, with a relative maximum or minimum at the critical points, and ensure the curve reflects the increasing and decreasing nature of the function in the specified intervals.
Outlines
📚 Introduction to Increasing and Decreasing Functions
The script introduces the concept of increasing and decreasing functions using the first derivative test. It defines a function as increasing on an interval if, for any two points within that interval, the function value at the left point is less than at the right point. Conversely, a function is decreasing if the function value at the left point is greater than at the right point. The script then explains that if the derivative is positive over an interval, the function is increasing on the corresponding closed interval, and if the derivative is negative, the function is decreasing. A constant function occurs when the derivative is zero. The script also discusses how changes in the sign of the derivative indicate relative maxima and minima.
📈 Analyzing Function Behavior with Derivatives
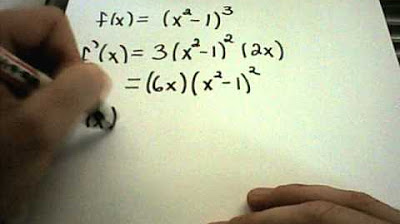
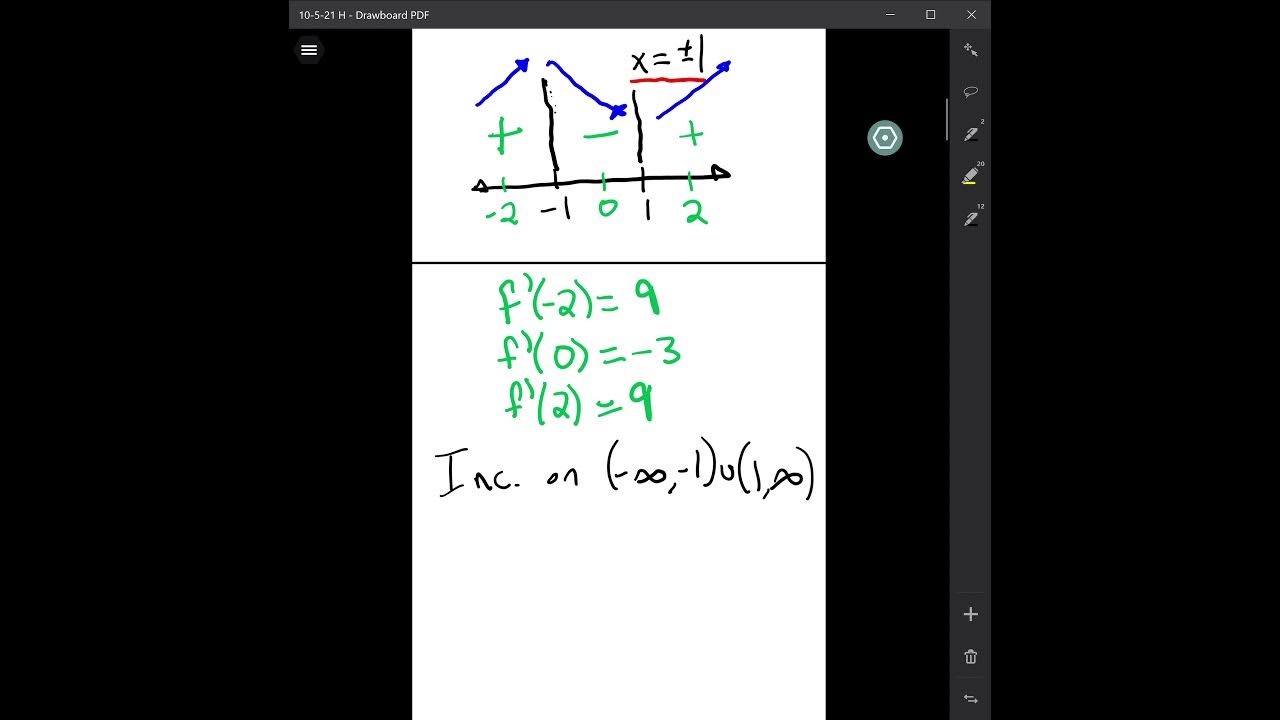
This paragraph delves deeper into analyzing the behavior of functions by examining the sign of their first derivatives. The script provides a step-by-step method to determine intervals of increase and decrease for a function, as well as identifying relative maxima and minima. It uses the example of a function with a derivative of \( x^2 - 2x - 3 \), factors it to find critical points at \( x = -1 \) and \( x = 3 \), and then tests the sign of the derivative in different intervals to determine the function's behavior. The script concludes with a sign chart and a brief mention of sketching the graph based on the findings.
📉 Understanding Critical Points and Graph Sketching
The script continues with a detailed explanation of how to find critical points and use them to sketch a function's graph. It introduces a new function with a derivative involving a cube root and explains how to find critical points by setting the numerator and denominator of the derivative to zero. The script then describes how to determine the intervals of increase and decrease by testing the sign of the derivative at various points around the critical values. It identifies relative maxima and minima based on the sign changes of the derivative and concludes with a discussion on sketching the graph, noting the importance of sharp turns at points where the derivative is undefined.
Mindmap
Keywords
💡Increasing Function
💡Decreasing Function
💡First Derivative Test
💡Critical Point
💡Relative Maximum
💡Relative Minimum
💡Constant Function
💡Factoring
💡Undefined Derivative
💡Sign Chart
Highlights
Introduction to increasing and decreasing functions and the first derivative test.
Definition of a function being increasing on an interval.
Definition of a function being decreasing on an interval.
Test for increasing function using the derivative.
Test for decreasing function using the derivative.
Condition for a function to be constant on an interval.
Explanation of critical points and their role in determining relative maxima and minima.
Procedure to find critical points by setting the derivative equal to zero.
Method to determine the sign of the derivative to identify intervals of increase and decrease.
Graphical representation of a function's behavior using sign charts.
Identification of relative maxima and minima based on changes in the derivative.
Sketching the graph of a function based on its increasing, decreasing intervals, and critical points.
Finding critical points for a function with a more complex derivative.
Understanding the impact of undefined derivatives on the graph of a function.
Graphical representation of a function with sharp turns due to undefined derivatives.
Explanation of how to handle functions with undefined derivatives in the context of sketching graphs.
Final summary of the process for analyzing functions using derivatives.
Transcripts
Browse More Related Video

3.1 - Using First Derivatives to Classify Max and Min Values

Graphing a Polynomial Equation :: Curve Sketching Using Calculus

Business Calculus - Math 1329 - Section 3.1 - Increasing and Decreasing Functions; Relative Extrema

Increasing/Decreasing + Local Max and Mins using First Derivative Test

Properties of Functions - Increasing vs Decreasing (Precalculus - College Algebra 9)

Relative Maxima/Minima Examples
5.0 / 5 (0 votes)
Thanks for rating: