Calculus 3: Three-Dimensional Coordinate Systems (Video #1) | Math with Professor V
TLDRThis video introduces the fundamentals of three-dimensional coordinate systems in calculus, explaining the transition from two to three dimensions. It covers the representation of points with ordered triples (X, Y, Z), the setup of the coordinate system with perpendicular axes, and the right-hand rule for orientation. The script delves into planes and surfaces, octants, and plotting points in 3D space. It also explores the extension of 2D graphs to 3D, including planes and parabolas, and discusses the three-dimensional distance formula, leading to the equation of a sphere. The video concludes with an explanation of how to describe regions represented by inequalities in 3D space.
Takeaways
- 📚 Introduction to Calculus 3 and the exploration of vectors and spatial geometry.
- 📏 Transition from two-dimensional Cartesian coordinate systems to three-dimensional systems, requiring an ordered triple (X, Y, Z) to specify a point.
- 📈 Understanding the three-dimensional coordinate system setup with mutually perpendicular axes, and the use of the right-hand rule to determine axis orientation.
- 🔍 Identification of coordinate planes such as XY, XZ, and YZ, each defined by setting one of the coordinates to zero.
- 🧭 Explanation of octants in three-dimensional space, with a focus on the first octant where all coordinates are positive.
- 📐 Techniques for plotting points in three dimensions, emphasizing the importance of proper labeling and scaling for accurate perspective.
- 📉 Graphing equations in 3D space as planes or surfaces, contrasting with their 2D counterparts like lines and curves.
- 🌐 Demonstration of graphing simple equations like x=2, y=3, and y=x in 3D, illustrating how they extend infinitely compared to their 2D line representations.
- ⚔ Use of the zero product property to graph equations involving the product of variables, such as xy=0, which represents both the YZ and XZ planes.
- 📐 Practice of sketching graphs in 3D, including the use of projection techniques to represent 2D graphs in three-dimensional space.
- 🔢 Derivation and application of the distance formula in three dimensions, extending the two-dimensional formula by adding the squared difference of the Z coordinates.
Q & A
What is the main topic of the first video in the calculus 3 series?
-The main topic of the first video is vectors and the geometry of space, specifically discussing three-dimensional coordinate systems.
How many coordinates are required to describe a point in a two-dimensional system?
-Two coordinates, typically represented as an ordered pair (X, Y), are required to describe a point in a two-dimensional system.
What is an ordered triple in the context of three-dimensional space?
-An ordered triple (X, Y, Z) is used to represent a point in three-dimensional space, where each value corresponds to a coordinate along the X, Y, and Z axes, respectively.
What is the right-hand-rule system and how is it used to determine the direction of the positive Z-axis?
-The right-hand-rule system is a common method to orient oneself in three-dimensional space. If you point the fingers of your right hand along the X-axis and then curl them towards the Y-axis, your thumb points in the direction of the positive Z-axis.
What are the equations for the XY, XZ, and YZ planes?
-The equation for the XY plane is Z = 0, for the XZ plane is Y = 0, and for the YZ plane is X = 0.
How many octants are there in a three-dimensional space?
-There are eight octants in a three-dimensional space.
What is the significance of the first octant in three-dimensional space?
-The first octant is significant because it is where all the coordinates X, Y, and Z are positive, and it is the most commonly referred to octant in discussions.
How can you plot a point in three-dimensional space?
-To plot a point in three-dimensional space, you move along the X, Y, and Z axes according to the point's coordinates, using sketching aids and proper perspective to ensure accuracy.
What is the difference between a curve in a two-dimensional system and a surface in a three-dimensional system?
-A curve in a two-dimensional system is the graph of an equation relating X and Y, while a surface in a three-dimensional system is the graph of an equation relating X, Y, and Z.
How does the video script illustrate the process of graphing equations in three-dimensional space?
-The script provides step-by-step instructions for graphing various equations in three-dimensional space, including using the right-hand-rule system, setting up coordinate planes, and plotting points and surfaces.
What is the purpose of sketching aids when plotting points in three dimensions?
-Sketching aids are used to provide proper perspective and ensure that points are plotted accurately along the X, Y, and Z axes, with correct scaling and labeling.
How does the video script explain the process of graphing the equation x = 2 in both two and three dimensions?
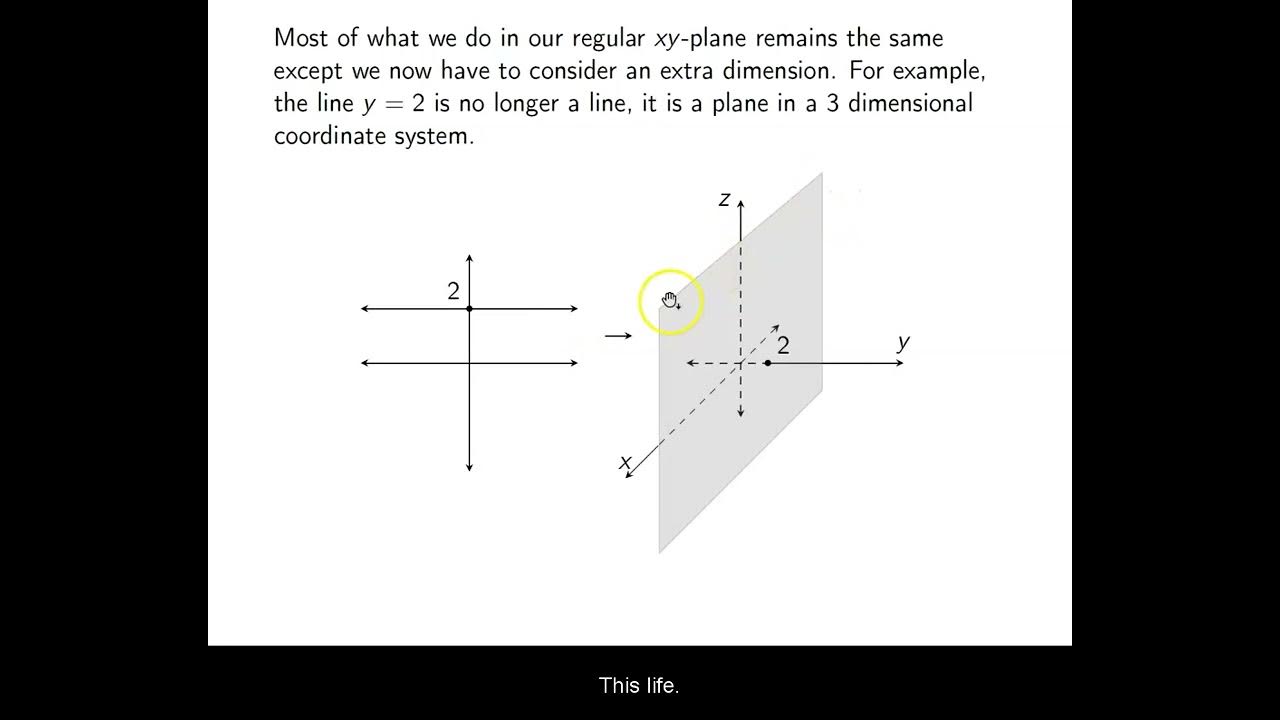
-In two dimensions, the script explains that x = 2 represents a vertical line. In three dimensions, it is represented as a plane that includes all values where x equals 2 and extends infinitely in the Z direction.
What is the relationship between the distance formula in two dimensions and three dimensions?
-The distance formula in two dimensions is extended to three dimensions by adding the squared difference of the Z coordinates to the sum of the squared differences of the X and Y coordinates.
How does the script describe the process of completing the square for an equation of a sphere?
-The script demonstrates completing the square for each variable (X, Y, Z) by adding the necessary constants to both sides of the equation to form perfect squares, which then allows for the equation to represent a sphere.
What is the difference between a parabola in two dimensions and its three-dimensional equivalent?
-In two dimensions, a parabola is represented by a curve. In three dimensions, the same parabola is projected parallel to the Z-axis, forming a surface that extends infinitely in the positive and negative Z directions.
How does the script explain the concept of three-dimensional inequalities?
-The script explains that three-dimensional inequalities can be graphed by first plotting the boundary, which is the equality, and then shading the region that satisfies the inequality, considering the inclusion or exclusion of the boundary.
What is the significance of the first octant in the context of the script?
-The first octant is significant as it is the region where all X, Y, and Z coordinates are positive, and it is the primary region discussed in the script for the purpose of graphing and understanding three-dimensional concepts.
Outlines
📚 Introduction to Calculus 3 and 3D Coordinate Systems
This paragraph introduces the first video in a series on Calculus 3, focusing on vectors and spatial geometry. It explains the transition from two-dimensional Cartesian coordinate systems, which require an ordered pair (X, Y), to three-dimensional systems requiring an ordered triple (X, Y, Z). The video script details the setup of a 3D coordinate system with perpendicular axes intersecting at the origin and describes the right-hand rule for orientation. It also explains the concept of coordinate planes (XY, XZ, YZ) and their respective equations, as well as the division of three-dimensional space into octants, with a focus on the first octant where all coordinates are positive. The paragraph concludes with a discussion on plotting points in 3D, emphasizing the importance of proper labeling and scaling of axes.
📈 Plotting Points and Graphing in 3D Space
The second paragraph delves into the practical aspects of plotting points in three-dimensional space, using the points (3, 2, 5) and (4, -2, -1) as examples. It describes the process of moving along the x, y, and z axes to reach the desired coordinates, highlighting the importance of perspective and accurate scaling. The paragraph then moves on to graphing in 3D, contrasting it with 2D graphing, starting with the equation x = 2, which graphs as a vertical line in 2D and as a plane in 3D. It continues with the equation y = 3, which graphs as a horizontal line in 2D and also represents a plane in 3D, and y = x, which is a line with a 45-degree angle in 2D and extends as a plane in 3D. The final example involves the equation xy = 0, which corresponds to graphing both the YZ and XZ planes in 3D.
📘 Advanced Graphing Techniques in 3D
This paragraph explores more complex graphing scenarios in three-dimensional space. It starts with the graph of y = x^2, a parabola in 2D, and extends this concept to 3D by projecting the graph parallel to the z-axis, creating a 3D representation. The next example is x^2 + z^2 = 16, which is a circle in the XZ plane when y is omitted. The graph is projected parallel to the y-axis to form a 3D shape. The paragraph also discusses graphing three-dimensional inequalities, such as x ≤ y, which in 2D is represented by a region above the line y = x, and in 3D, it is represented by all points behind the plane y = x. The summary emphasizes the importance of understanding the relationship between 2D and 3D graphs and the techniques for extending them into three-dimensional space.
🔍 Deriving the 3D Distance Formula and Its Applications
The fourth paragraph discusses the derivation of the three-dimensional distance formula by extending the two-dimensional version. It uses a rectangular solid with vertices at distinct points (x1, y1, z1) and (x2, y2, z2) to illustrate the process. By considering the differences in coordinates as sides of a right triangle and applying the Pythagorean theorem, the paragraph shows how to arrive at the 3D distance formula, which includes the square of the difference in z-coordinates. The summary also explains how the 2D distance formula leads to the equation of a circle, and similarly, the 3D formula leads to the equation of a sphere. Examples of writing the equation of a sphere with a given center and radius are provided, demonstrating the practical application of the formula.
🌐 Completing the Square for Sphere Equations and Describing 3D Regions
In this paragraph, the process of completing the square for the equation of a sphere is explained, with an example that starts with an equation involving x, y, and z terms. By dividing through by 2 and adding the necessary constants to complete the square for each variable, the equation is transformed into the standard form of a sphere, revealing the center and radius. The summary also includes a description of a region defined by an inequality involving the sum of squared coordinates, which represents all points between two concentric spheres with radii 1 and 5, respectively. The paragraph concludes by emphasizing the ability to describe such regions in words without the need for a graphical representation.
🎯 Conclusion of the First Calculus 3 Video
The final paragraph wraps up the first video in the Calculus 3 series by summarizing the topics covered, including the 3D coordinate system, graphing in three dimensions, the derivation and application of the 3D distance formula, and the completion of the square for sphere equations. It emphasizes the importance of understanding these foundational concepts for further study in calculus and spatial geometry. The paragraph leaves the viewer with a clear understanding of the material presented and sets the stage for future videos in the series.
Mindmap
Keywords
💡Three-dimensional coordinate system
💡Ordered triple
💡Surface
💡Right-hand-rule system
💡Coordinate plane
💡Octant
💡Plotting points
💡Graphing equations
💡Distance formula
💡Sphere
💡Three-dimensional inequalities
Highlights
Introduction to the first video in the Calculus 3 series focusing on vectors and the geometry of space.
Discussion on transitioning from two-dimensional to three-dimensional coordinate systems.
Explanation of representing a point in 3D space using an ordered triple (X, Y, Z).
Description of setting up a three-dimensional coordinate system with mutually perpendicular axes.
Introduction to the right-hand-rule system for determining the direction of positive axes.
Explanation of coordinate planes, including the XY, XZ, and YZ planes.
Clarification of the concept of octants in three-dimensional space, contrasting with quadrants in two dimensions.
Demonstration of plotting points in three dimensions using sketching aids for perspective.
Illustration of graphing equations in 3D space, such as x=2 representing a plane.
Presentation of graphing y=3 in 3D space, resulting in a different plane compared to the 2D line.
Explanation of how the line y=x in 2D translates to a plane in 3D space.
Discussion on graphing the equation xy=0 in 3D, which corresponds to both the YZ and XZ planes.
Introduction to graphing three-dimensional inequalities, such as x ≤ y, and their representation in 3D space.
Extension of the two-dimensional distance formula to three dimensions by adding the z-component.
Derivation of the equation of a sphere from the three-dimensional distance formula.
Example of writing the equation of a sphere given a center and radius.
Description of a region represented by an inequality between two sphere radii without the need for graphing.
Transcripts
Browse More Related Video

Three-Dimensional Coordinates and the Right-Hand Rule
Ch. 9.3 Three Dimensional Coordinate Geometry
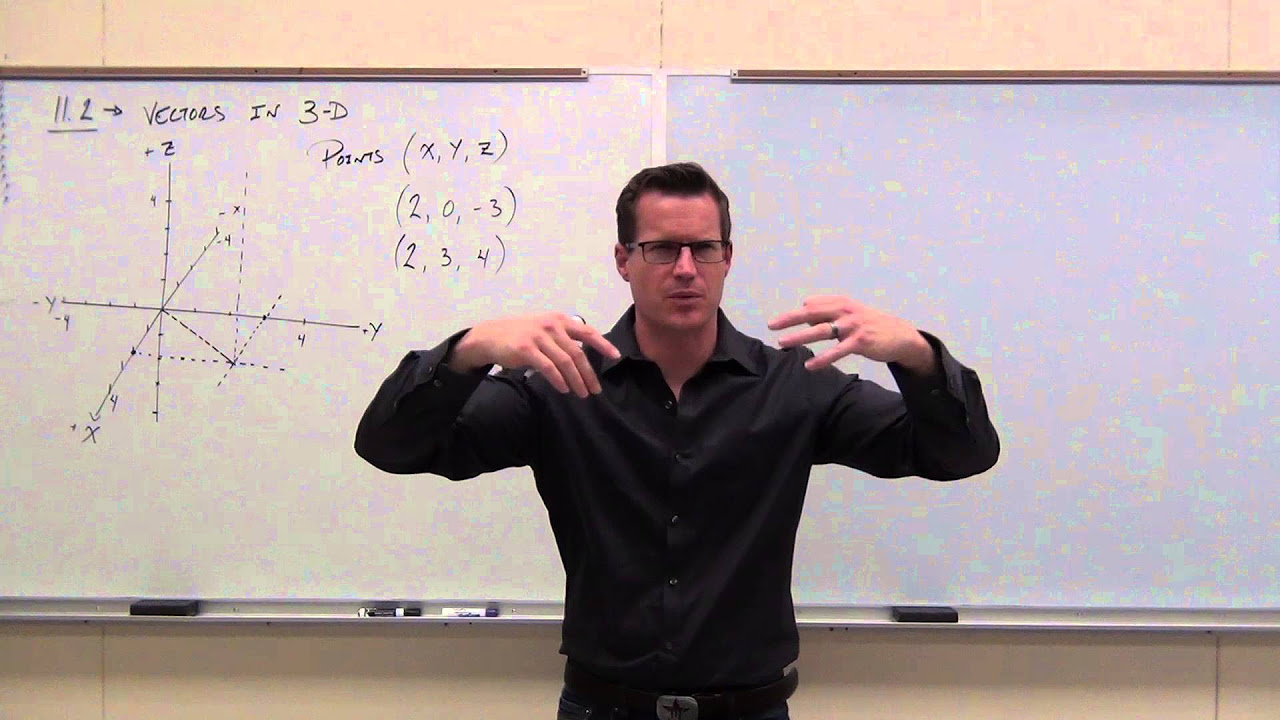
Calculus 3 Lecture 11.2: Vectors in 3-D Coordinate System
Intercepts and Traces of Surfaces (in 3D Space)
Midpoint in 3D Space (Calculus 3)

Introduction to 3d graphs | Multivariable calculus | Khan Academy
5.0 / 5 (0 votes)
Thanks for rating: