Two-way ANOVA in GraphPad Prism
TLDRJames Clark from King's College London presents a tutorial on conducting a two-way ANOVA in GraphPad Prism. He explains the test's application for analyzing the effects of two nominal variables on a measurement variable, such as the impact of a drug on different cell types over time. The video guides viewers through data table formatting, analysis setup, and interpretation of results, including multiple comparisons and narrative summaries, to determine the significance of observed effects.
Takeaways
- 📚 James Clark from King's College London presents a tutorial on conducting a two-way ANOVA in GraphPad Prism.
- 🔍 A two-way ANOVA is used when there is one measurement variable and two nominal variables, each in combination with the other.
- 📈 The example given involves comparing the viability of two different cell types exposed to a drug over time.
- 🧬 The nominal variables in the example are genotype and time, with the measurement variable being cell viability.
- 🔮 The test evaluates three null hypotheses: equality of means across different values of the first nominal variable, equality of means across different values of the second nominal variable, and no interaction effect.
- 📊 GraphPad Prism requires data to be formatted in a group table with replicate values in side-by-side sub-columns.
- 📝 The tutorial demonstrates how to set up a two-way ANOVA in Prism, including selecting the appropriate analysis options and data sets.
- 🔄 The video explains the different tabs in the Parameters window, including repeated measures design, factor names, and multiple comparisons.
- 📉 Multiple comparison tests are defined in Prism, allowing for various options to compare rows, columns, or both.
- 📝 The post hoc test to be used can be selected, with Tukey's test being recommended in the example.
- 📊 The results of the two-way ANOVA are presented in the Results section, including ANOVA results, multiple comparison results, and narrative results.
- 📝 Narrative results provide a plain English interpretation of the statistical test outcomes, helping to determine the relevance to the hypothesis.
Q & A
What is the purpose of a two-way ANOVA in research?
-A two-way ANOVA is used to analyze the differences between the means of more than two groups, considering the effects of two nominal variables and their interaction on a measurement variable.
What are the two nominal variables and the measurement variable in the given example?
-In the example, the two nominal variables are genotype (with two different cell types) and time, while the measurement variable is the viability of the cells.
What are the three null hypotheses tested in a two-way ANOVA?
-The three null hypotheses tested are: 1) the means of the measurement variable are equal for different values of the first nominal variable, 2) the means are equal for different values of the second nominal variable, and 3) there is no interaction effect between the two nominal variables.
Why would one choose a two-way ANOVA over a one-way ANOVA?
-A two-way ANOVA is chosen over a one-way ANOVA when there are two nominal variables and their interaction needs to be considered, rather than just one measurement variable and one nominal variable.
How should the data be formatted in GraphPad Prism for a two-way ANOVA?
-The data should be formatted as a group table in GraphPad Prism, with each nominal variable represented in the columns and rows, and the measurement variable in the cells.
What is the significance of the p-value in the two-way ANOVA results?
-The p-value indicates the probability that the observed differences between group means are due to chance. A low p-value suggests that there is a significant effect of the nominal variables and/or their interaction on the measurement variable.
What is the role of multiple comparison tests in a two-way ANOVA?
-Multiple comparison tests are used to determine which specific group means are significantly different from each other after a significant F-test in the ANOVA, while controlling for the Type I error rate.
What does the term 'post hoc test' refer to in the context of ANOVA?
-A post hoc test is a statistical test used after an ANOVA to determine the source of significant differences among group means when the ANOVA indicates that at least one mean is different.
How does GraphPad Prism assist in the process of conducting a two-way ANOVA?
-GraphPad Prism guides the user through the process of setting up the analysis, including data formatting, selecting the appropriate test, and interpreting the results, including the provision of a narrative summary.
What is the importance of considering the study design when choosing multiple comparison tests?
-The study design influences which multiple comparison tests are appropriate, as different tests make different assumptions about the relationships between groups and control for different types of errors.
What is the purpose of the narrative results feature in GraphPad Prism?
-The narrative results feature in GraphPad Prism provides a plain English summary of the statistical outcomes, making it easier for researchers to understand the implications of their ANOVA results.
Outlines
🔬 Conducting a Two-Way ANOVA in GraphPad Prism
James Clark from King's College London introduces the process of performing a two-way ANOVA using GraphPad Prism. This statistical method is suitable for analyzing the effects of two nominal variables on a single measurement variable, such as comparing the viability of two different cell types exposed to a drug over time. The video explains the null hypotheses tested, including equality of means across different values of the nominal variables and the absence of interaction effects. It also demonstrates how to format data in a group table, enter replicate values, and plot graphs in Prism. The tutorial guides viewers through accessing the analysis feature and choosing the appropriate options for a two-way ANOVA.
📊 Understanding Two-Way ANOVA Parameters and Multiple Comparisons
The second paragraph delves into the parameters window of a two-way ANOVA in GraphPad Prism, which is divided into six tabs. It discusses the setup for repeated measures designs, which is not applicable to the current study. The focus then shifts to defining multiple comparisons and post hoc tests, explaining the options available and how they affect the analysis. The paragraph also covers the selection of an appropriate multiple comparisons test, such as Tukey's, Bonferroni's, or other methods, and the implications of these choices on the study's outcomes. It concludes with the options for generating narrative results and residual graphs, emphasizing the importance of selecting the right analysis parameters to ensure the study's relevance.
📈 Interpreting Two-Way ANOVA Results and Narrative Summaries
The final paragraph provides an overview of interpreting the results of a two-way ANOVA in GraphPad Prism. It explains the significance of the p-value, degrees of freedom, F values, and means in the context of the study. The paragraph highlights the importance of multiple comparisons in determining significant differences between groups and the narrative results that offer a plain English interpretation of the statistical findings. The video concludes by emphasizing the need to assess the relevance of the results to the experimental model and hypothesis, suggesting that while Prism provides a structured approach to analysis, the interpretation of outcomes is crucial for understanding the experiment's impact.
Mindmap
Keywords
💡Two-way ANOVA
💡GraphPad Prism
💡Measurement variable
💡Nominal variables
💡Null hypotheses
💡Interaction effect
💡Group table
💡Replicates
💡Post hoc tests
💡Narrative results
💡Residuals
Highlights
James Clark from King's College London presents a tutorial on performing a two-way ANOVA in GraphPad Prism.
A two-way ANOVA is used when there is one measurement variable and two nominal variables.
The tutorial provides an example with two different cell types exposed to a drug over time, with viability as the measurement variable.
The test evaluates three null hypotheses: equality of means for different values of nominal variables and no interaction effect.
The video demonstrates the process of setting up a group table in Prism for the two-way ANOVA.
Prism automatically plots graphs for the data, which can be used for initial analysis.
The video explains how to initiate a two-way ANOVA analysis through the Analyze button in Prism.
The parameters window in Prism is divided into six tabs, including options for repeated measures design.
The tutorial clarifies that the study presented does not involve repeated measures due to different cells being used at each time point.
Prism allows for the selection of multiple comparison tests and the definition of post hoc tests.
The video describes the different options for multiple comparisons, such as comparing rows, treatments, or all cell means.
The selection of a post hoc test, such as Tukey's, is guided by Prism's recommendations.
The tutorial covers additional options for narrative results and the creation of residual graphs.
The results of the two-way ANOVA are presented in the results section of Prism, with detailed statistical information.
The ANOVA results include F values, degrees of freedom, and means, which are crucial for interpreting the data.
The multiple comparison results provide a detailed analysis of the differences between groups, with adjusted p-values.
Narrative results offer a plain English interpretation of the statistical findings, aiding in understanding the experiment's outcome.
The video concludes by emphasizing the importance of determining the relevance of results based on the hypothesis.
Transcripts
Browse More Related Video
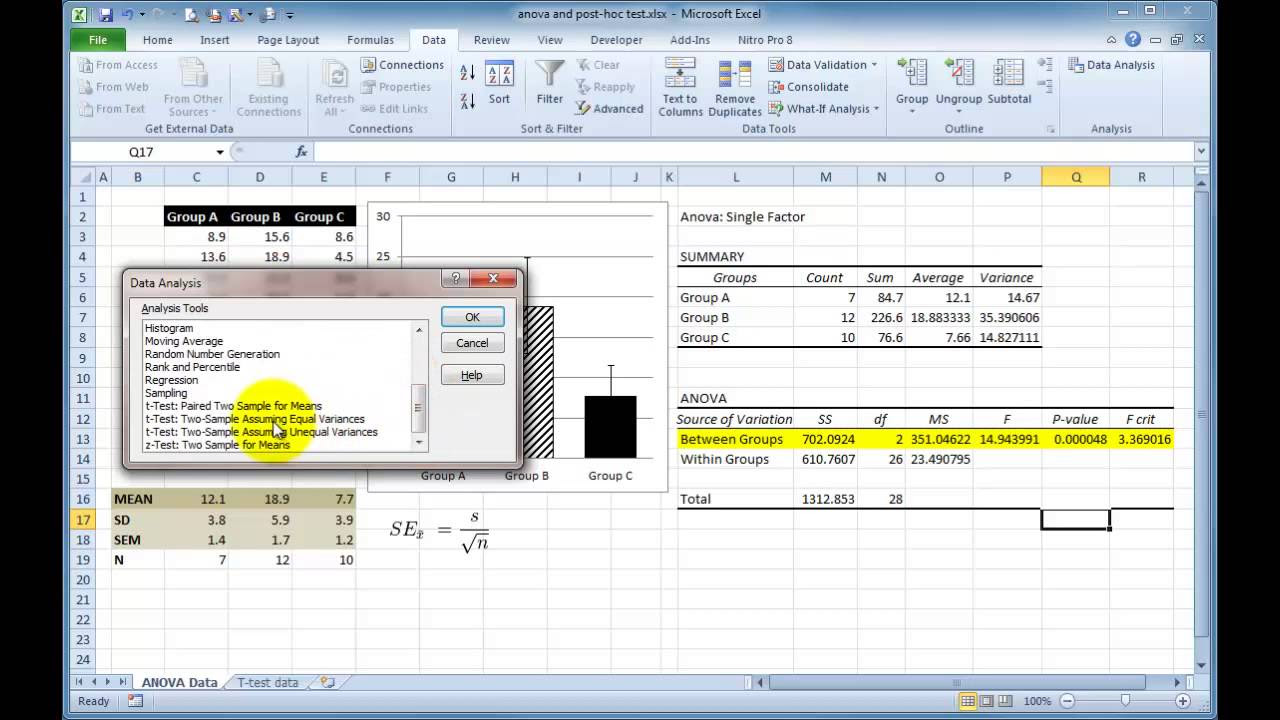
Performing a One-way ANOVA in Excel with post-hoc t-tests

Introduction to Two Way ANOVA (Factorial Analysis)
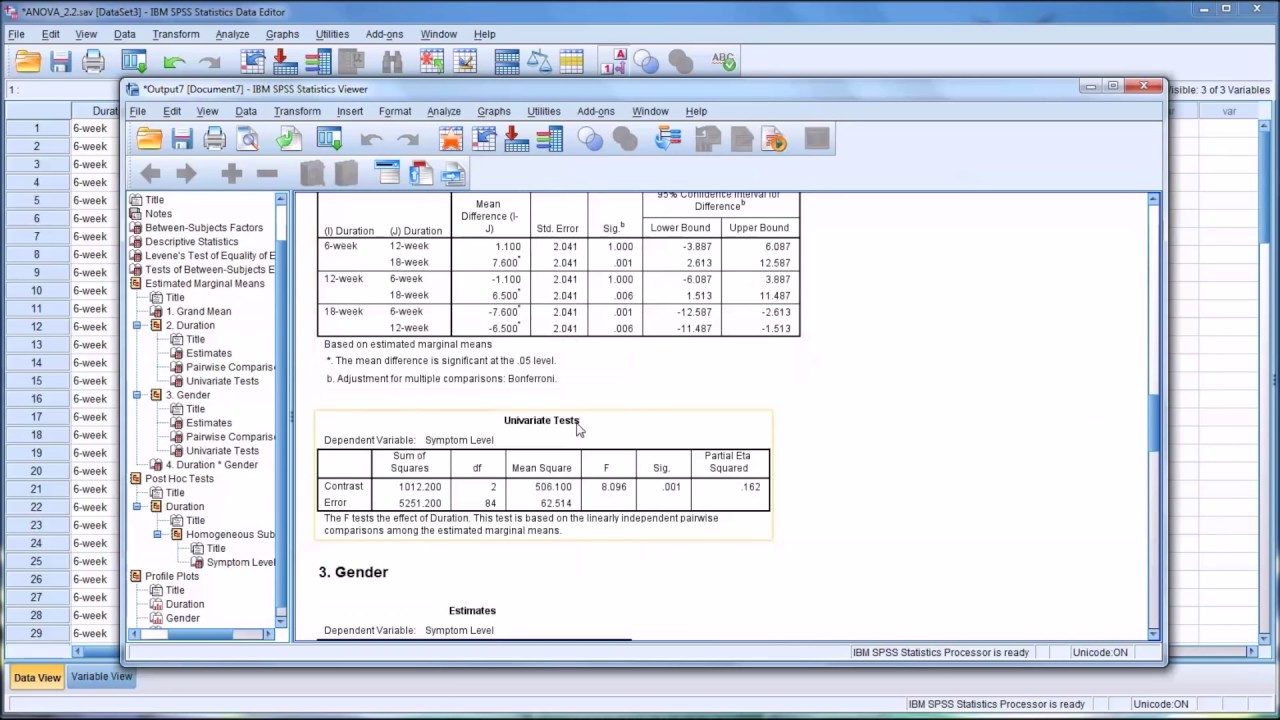
Conducting a Two-Way ANOVA in SPSS

Two-Way ANOVA - Full Course

Setting Variables with Levels of Measurement: Discover Statistics with JASP for Beginners (3 of 6)
Two factor ANOVA with repeated measures
5.0 / 5 (0 votes)
Thanks for rating: