Ace Statistics Interviews: A Data-driven Approach For Data Scientists
TLDRThis video offers a data-driven approach to preparing for common statistics questions in data science job interviews. Host Emma from Amazon.com identifies top concepts like p-value, linear regression, t-tests, correlation coefficient, and types of errors. She explains the p-value's significance in hypothesis testing and provides a real-world example using a productivity app. The video also covers linear regression assumptions, t-test conditions, and the difference between covariance and correlation coefficient. A free cheat sheet is available to help viewers tackle over 40% of potential interview questions, boosting confidence and interview success.
Takeaways
- 📊 Statistics can be daunting, especially in data science job interviews, where unexpected questions may arise.
- 💼 Emma from Amazon.com offers proactive tips and strategies for interviews, including preparing for statistics questions.
- 🔍 Emma analyzed over 300 statistics interview questions from 50+ companies, identifying common concepts and patterns.
- 🔑 The most common statistics questions focus on fundamental concepts such as p-value, linear regression, t-test, correlation coefficient, and types of errors.
- 🎯 P-value is the most important concept, appearing in over 10% of interview questions, and is crucial for hypothesis testing.
- 📉 P-value measures the likelihood of observing results as extreme as the sample, assuming the null hypothesis is true, with a common threshold of 0.05.
- 📈 Linear regression assumptions can be remembered by the acronym LINE, standing for Linearity, Independence, Normality, and Equal variance of residuals.
- 🧐 T-tests are used to determine if two groups have different means and share most assumptions with linear regression, except for the linearity aspect.
- 🔗 The correlation coefficient indicates the strength of the linear relationship between two variables, while covariance focuses on the direction of the relationship.
- 🚫 Type 1 error occurs when incorrectly rejecting a true null hypothesis, while Type 2 error happens when failing to reject a false null hypothesis.
- 📚 Emma provides a free cheat sheet covering frequently asked statistics interview questions to help prepare for over 40% of potential interview questions.
Q & A
What is the main purpose of the video?
-The main purpose of the video is to explore the top statistics questions that often come up in data science job interviews and to present them in an easy-to-understand way, even for those who haven't studied statistics recently.
Who is the speaker in the video?
-The speaker in the video is Emma from Amazon.com, who aims to help viewers land their dream data scientist job by providing tips and strategies for interviews and offer negotiations.
How many statistics interview questions did Emma analyze from different companies?
-Emma analyzed over 300 statistics interview questions from over 50 different companies.
What are the top five statistics concepts that frequently come up in interviews according to the video?
-The top five statistics concepts that frequently come up in interviews are p-value, linear regression, t-test, correlation coefficient, and types of errors.
What is the significance of the p-value in data science interviews?
-The p-value is significant in data science interviews as it is the most commonly asked question, appearing in over 10 percent of the questions, with almost half of the companies asking about it.
How is the p-value defined and what does it measure?
-The p-value is a tool in hypothesis testing that measures the likelihood of obtaining results as extreme as the ones observed in a sample, assuming the null hypothesis is true.
What is the common cut-off value for the p-value and what does it imply?
-The common cut-off value for the p-value is 0.05. If the p-value is less than 0.05, it implies strong evidence against the null hypothesis, allowing for its rejection. If it's greater than 0.05, it indicates weak evidence and the null hypothesis cannot be rejected.
Can you provide an example of how to explain the p-value to a non-technical audience?
-An example given in the video involves a productivity app called Notion. By comparing the productivity of two groups, one using the app and the other not, the p-value can determine if the difference in productivity is statistically significant or due to chance.
What are the four key assumptions of linear regression and how can they be remembered?
-The four key assumptions of linear regression are linearity (L), independence (I), normality (N), and equal variance (E). They can be remembered using the acronym LINE.
What does the acronym 'LINE' stand for in the context of linear regression assumptions?
-The acronym 'LINE' stands for Linearity, Independence, Normality, and Equal variance, which are the four key assumptions to consider in linear regression.
How can you differentiate between covariance and correlation coefficient?
-Covariance focuses on the direction of the relationship between two variables, while the correlation coefficient measures the strength of the linear relationship. The correlation coefficient is unitless and ranges between -1 and 1, whereas covariance has units that are the product of the units of the two variables.
What are the two main types of errors in hypothesis testing?
-The two main types of errors in hypothesis testing are Type I error, which is a false positive (mistakenly concluding there is a difference when there isn't), and Type II error, which is a false negative (failing to detect a true difference).
How can you remember the difference between Type I and Type II errors?
-Type I error can be remembered as a false positive, which contains only one instance of the word 'false'. Type II error can be remembered as a false negative or a 'false false', which helps by repeating the word 'false'.
What resource does Emma offer to help viewers prepare for statistics interview questions?
-Emma offers a free cheat sheet that covers the most frequently asked statistics interview questions, which can be downloaded by clicking the link provided in the video description.
Outlines
📊 Mastering Statistics for Data Science Interviews
This paragraph introduces the video's focus on preparing for data science job interviews with a particular emphasis on statistics. The speaker, Emma from Amazon.com, shares her experience and insights gathered from analyzing over 300 interview questions from various companies. The goal is to make complex statistical concepts easy to understand and to highlight the top five most frequently asked questions: p-value, linear regression, t-test, correlation coefficient, and types of errors. The p-value is emphasized as the most important concept, with a structured approach to explaining it in interviews. The video promises to cover all this in under 15 minutes, aiming to boost viewers' confidence in tackling statistical questions in interviews.
📈 Understanding P-Values and Linear Regression Assumptions
The second paragraph delves into the concept of the p-value, explaining its role in hypothesis testing and how it helps to determine the significance of observed results. A structured approach to explaining p-values in interviews is provided, including its definition, the interpretation of different p-value thresholds, and its practical application in A/B testing. The paragraph also introduces the assumptions of linear regression, using the acronym 'LINE' to remember them: Linear relationship, Independence, Normality, and Equal variance of residuals. A free cheat sheet covering frequently asked statistics interview questions is offered to help viewers prepare more effectively for interviews.
🔍 Exploring T-Tests, Correlation, and Hypothesis Testing Errors
This paragraph continues the discussion on statistical concepts important for data science interviews, starting with t-tests. It outlines the assumptions of t-tests using the acronym 'I and E' for Independence and Normality, and Equal variance, and explains the use of t-tests to determine if two groups have different means. The paragraph then contrasts covariance and correlation coefficient, highlighting the correlation coefficient's unitless nature and its range between -1 and 1, versus covariance which is unit-dependent and can vary. Lastly, it addresses the two main types of errors in hypothesis testing: Type I (false positive) and Type II (false negative) errors, providing examples and a mnemonic to help remember the concepts. Additional resources, such as dedicated videos on t-tests and hypothesis testing, are mentioned for further learning.
Mindmap
Keywords
💡Statistics
💡Data Science Job Interview
💡P-value
💡Hypothesis Testing
💡Linear Regression
💡Assumptions
💡T-test
💡Correlation Coefficient
💡Covariance
💡Type I and Type II Errors
💡Confidence
Highlights
The video aims to prepare viewers for common statistics questions in data science job interviews.
Emma from Amazon.com provides tips and strategies for job interviews and offer negotiations.
A data-driven approach is used to analyze over 300 statistics interview questions from 50 companies.
Fundamental concepts like p-value, linear regression, t-test, correlation coefficient, and types of errors are frequently asked.
P-value is the most important concept, appearing in over 10% of interview questions.
The p-value measures the likelihood of observing results as extreme as the sample, assuming the null hypothesis is true.
A p-value less than 0.05 indicates strong evidence against the null hypothesis.
The concept of p-value is applied in A/B testing to determine significant differences between groups.
Simple examples, like a productivity app scenario, are used to explain p-value to non-technical audiences.
Linear regression assumptions are remembered using the acronym LINE.
The independence of residuals and normal distribution of residuals are key assumptions for linear regression.
Equal variance assumption ensures consistent spread of residuals across different values of X.
A cheat sheet covering frequently asked statistics interview questions is available for download.
T-tests are used to determine if two groups have different means and have specific assumptions similar to linear regression.
The correlation coefficient measures the strength and direction of the linear relationship between two variables.
Covariance and correlation coefficient are distinguished by their focus on relationship direction and strength.
Type 1 error occurs when concluding a difference where there isn't one, like falsely claiming a change in button color affects conversion rates.
Type 2 error is the failure to detect a real difference, such as not recognizing a button color change's impact on conversion rates.
A mnemonic device is provided to remember type 1 and type 2 errors as 'false positive' and 'false negative'.
Further resources include videos on hypothesis testing and a playlist dedicated to statistics interview questions.
The video encourages continuous learning and curiosity to boost confidence in data science interviews.
Transcripts
let's be honest statistics can seem
daunting especially when it comes up
during a data science job interview
sometimes it feels like no matter how
much you have prepared there are those
unexpected questions that catch you off
guard so how can you get ready for them
in this video we are going to explore
the top statistics questions that often
come up in these interviews using a
data-driven approach and we present
everything in a way that's easy to
understand even if it's been a while
since you last studied statistics the
best part we are going to go over all of
this in less than 15 minutes are you
ready let's dive in hey this is
professionals it's Emma from amazon.com
we're all about helping you land your
dream data scientist job we offer
proactive tips and strategies online
interviews preparing for interviews and
negotiating offer so if you're new here
consider subscribing now let's dive into
this topic I'll be through my fair share
of interviews where I stumbled upon
statistics questions that left me is
scratching my head let me tell you it
wasn't a great feeling but as I gained
more experience I started noticing a
pattern some Concepts come up more
frequently than others to back up my
observations I decided to take a daily
driven approach I'm gathered and
analyzed over 300 statistics interview
questions from over 50 different
companies and guess what my findings
confirmed what I suspected I'm really
excited to share all of this with you
firstly I discovered that the most
common asked questions in this
interviews focus on fundamental concepts
these concepts are super important to
grasp so in this video we are going to
dive into the top five Concepts that
come up most often they are p-value
linear regression t-test correlation
coefficient and types of Errors now out
of all these Concepts p-value stands out
as the most important one in data
science interviews it appears over 10
percent end of the questions almost half
of the companies out there asking dates
to explain what a p-value is so it's
crucial that you understand this concept
inside out and how it's commonly used
this will greatly increase your chances
of easing your next interview now let's
take closer look at each of these
Concepts one by one
let's dive into the concept of the
p-value usually you will come across a
question about how to explain it will
provide a structured answer by breaking
it down into a few steps we'll look at
the definition the meaning of its values
and its application to answer this
question the p-value is a useful tool in
hypothesis testing to help us make sense
of our observations and draw conclusions
simply put the p-value measures How
likely we are to get results as Extreme
as the ones we observed in our sample
assuming that our initial assumption the
null hypothesis is true when we say as
extreme we mean results that provide
enough evidence to support an
alternative hypothesis a low p-value
means that we have less support of the
null hypothesis in practice we often use
a cut value of 0.05 if the p-value is
less than 0.05 it means we have strong
evidence against the null hypothesis so
we can reject it on the other hand if
the p-value is greater than 0.05 it
means we have weak evidence against the
null hypothesis so we can't reject it
one common application of the p-value is
in a b testing imagine we have a
treatment group and a control group and
we want to determine if there's a
difference between them in terms of a
specific metric we run experiment and
collect data from both groups the
smaller the p-value the more content we
can be that there's actually a
difference between the two groups now
we've discussed what the p-value is
another common ask question is how to
explain it to a non-technical audience a
helpful method is to use Simple examples
let's consider a scenario involving a
productivity app called notion you and
your colleagues want to improve
efficiency and accomplish more tasks
within the limited time you have to test
effectiveness of notion you decide to
run an experiment you divide your team
into two groups one group uses the app
to manage their tasks and attract their
progress while the other group continues
with their typical task management
methods after a period of time you
evaluate the productivity of each group
now we can bring in the concept of the
p-value to evaluate the significance of
the results you calculate the p-value to
determine if the difference in
productivity between the two groups is
statistically significant or if it could
be due to chance a low P value would
suggest that the app is likely effective
in boosting productivity on the other
hand a high P value would indicate that
the observed differences in productivity
could be due to random factors other
than the app itself by considering the
p-value we can make a more informed
decision about whether notion is likely
to be beneficial for improving
productivity so now that we've covered
p-value let's dive into another
important topic linear regression
another question we often encounter is
what are the assumptions of linear
regression don't worry if you don't know
I'll break them down for you in a simple
way there are four key assumptions that
we need to consider and we can remember
them easily with the acronym line let's
start with the first assumption
represented by the letter L it's all
about the relationship between the
independent variable let's call it X and
the dependent variable which we'll call
Y the sum is that the value on y changes
in linear manner with X moving on to the
second assumption represented by the
letter i it stands for the Assumption of
statistical Independence of the
residuals residuals are the differences
between the actual y values and the
predicted y values from the regression
model we want these residuals to be
independent of each other meaning that
the value of one residual does not
influence the value of another
now let's talk about the third
assumption represented by the letter N
it suggests that the residuals follow a
normal distribution
in similar terms if we were to plot the
procedures on graph we'd want them to
form a nice symmetric bell-shaped curve
however in large samples this assumption
becomes less critical
finally we have the fourth assumption
represented by the letter e it stands
for equal variance we want the
variability of the residuals to be
consistent across different values of X
this means that the spread of the
residuals shouldn't change as X
increases or decreases so to summarize
the Assumption of linear regression can
be remembered using the acronym line we
have the L for the linear relationship
between X and Y the I for the
independence of residuals the N for
normal distribution of residuals and the
E for equal variance of residuals and
that concludes our discussion of the
first two statistics Concepts in
intervals now if you are eager to delve
deeper into this subject and want to
discover more about the insights I
gained from analyzing over 300
statistics interview questions I've got
something special for you I'll put
together a handy cheat sheet that covers
the most frequently Asked statistics
interview questions
by familiarizing yourself with these
questions you'll be equipped to answer
more than 40 percent of the interview
questions you may encounter best of all
you can download this cheat sheet
absolutely free just click the link
provided in the video description below
alright let's now proceed with our list
of questions next let's dive into the
topic of t-tests it's a concept that
often comes up interviews and is really
useful to understand so what are the
assumptions of the t-test and one can
actually use it let's break it down
aditas is a statistical tool that helps
us determine if two groups have
different means and there are a few key
assumptions we need to keep in mind when
using it actually most of the
assumptions of linear regression also
apply to t-tests except for the one
about linear relationship so we can
simplify it using the acronym i and e to
remember the assumptions let's go
through them one by one the i in i and e
stands for Independence it simply means
that the observations within each group
or sample should be independent of each
other in other words the samples in one
group shouldn't be influenced by other
samples in the same group moving on to
the end the i and e which stands for
normality this assumption tells us that
the data in each group or the
differences between the groups should
roughly follow a normal distribution it
means that the data should kind of look
like a bell curve however even if the
data doesn't perfectly fit that shape
the T Test can still handle well
especially when we have a large sample
size as the central limit theorem states
that the sampling distribution of the
sample means will be approximately
normal regardless of the shape of the
population distribution
finally the e in i and e stands for
equal variance if we are comparing the
means of two independent groups its
ideal is the variances of these groups
are roughly the same this assumption is
crucial for interpreting the results
accurately but if the sample balances
are significantly different we can use
alternative versions of the t-test like
a Welch's t-test these variants do not
require equivalences and can provide
valid outcomes now if you want to learn
more about how to use a t-test for one
sample or two simple tests I've got
dedicated videos on those topics with
implementation in Python you can find
them in this video description below all
right let's look at another popular
Topic in statistics the correlation
coefficient a question that often comes
up is how to tell the difference between
covariance and correlation coefficient
here's a table that summarizes the main
differences between them the correlation
coefficient tells us how strong the
linear relationship between two
variables is while covariance focuses on
the direction of the relationship to
calculate the correlation coefficient
you divide the covariance by the square
root of the product of the viruses of
the two variables now when it comes to
the units of the measurement the
correlation coefficient is unitless this
means that even if you use different
units for the original variables it
won't affect the correlation coefficient
as long as there's a linear relationship
between the variables on the other hand
covariance is obtained by multiplying
the units of the two variables together
here's another key difference the
absolute value of the covariance cannot
be greater than product of the standard
deviations of the individual variables
however the correlation coefficient
always 4 between negative 1 and 1. so
these two majors help us understand the
strength and direction of the linear
relationship between two variables I
hope this helps explain the distinction
between them for you now let's move on
to discussing the fifth question that is
about different types of errors in
hypothesis testing there are two main
types that we need to understand let's
start with the first one the type 1
error type 1 error occurs when we
mistakenly conclude that there is a
difference between two groups even
though in reality there isn't to make it
clearer let's consider an example of a b
testing imagine we are working for an
e-commerce company and we want to find
out if changing the color of the binary
button on the app will increase the
number of people who actually make a
purchase so a Time One error occurs when
we claim that changing the button color
from Blue to Yellow will result in a
significant difference in the conversion
rate however in reality there's no
actual difference in conversion rates
between the two colors now let's move on
to the second type of error known as a
type 2 error this happens when we make
the mistake of failing to reject a false
null hypothesis in simpler terms it
means that we conclude there is no
significant difference between the
groups when in fact there is a
difference
so going back to our previous example we
might conclude that changing the button
color won't have a significant impact on
the conversion rate but the truth is it
actually does make a difference so we
fail to detect the difference between
the two colors
to help you remember this Concepts
easily here's a handy tip that I found
on stack exchange.com you can think of a
type 2 error as a false negative or a
false false by repeating the word false
it becomes easier to remember on the
other hand a type 1 error is a false
positive because it only contains one
instance of the word false
now if you're interested in diving
deeper into hypothesis testing I've got
a video for you check out my video on AV
testing analysis Made Easy how to use
hypothesis testing for data science
intervals in this one we take a closer
look at how hypothesis testing applies
to AP testing a topic that is often
discussed intervals and don't forget to
also watch my top 5 statistic Concepts
in data science interviews video it's a
fantastic resource where you can learn
about other important Concepts that
might show up in your next interview by
the way I've put together a whole
playlist dedicated to helping you crack
those tough statistics interview
questions it's not just beneficial for
interviews but it will also boost your
skills as a data scientist remember the
more you know the more confident you
will be so stay curious keep learning
and I have no doubt that you will excel
in your next interview thanks for
watching and I will see you soon
foreign
Browse More Related Video
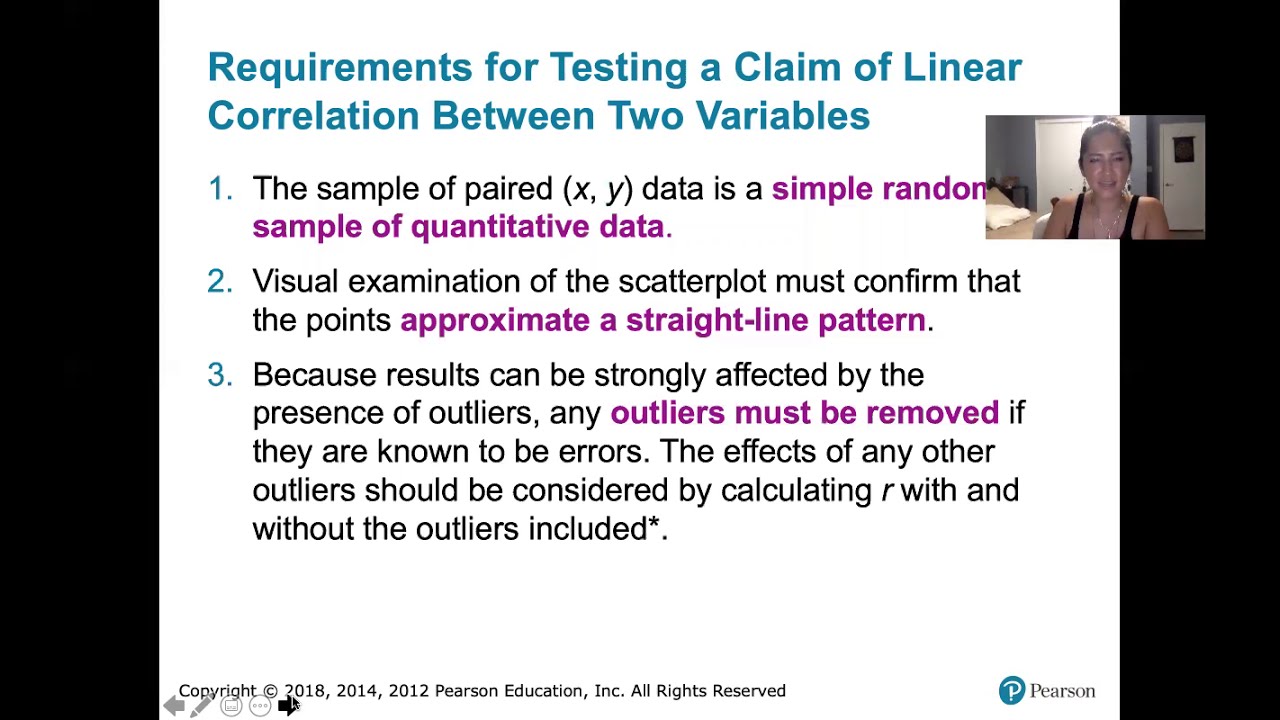
10.1.5 Correlation - Testing a Claim of Correlation Using the P-Value Method
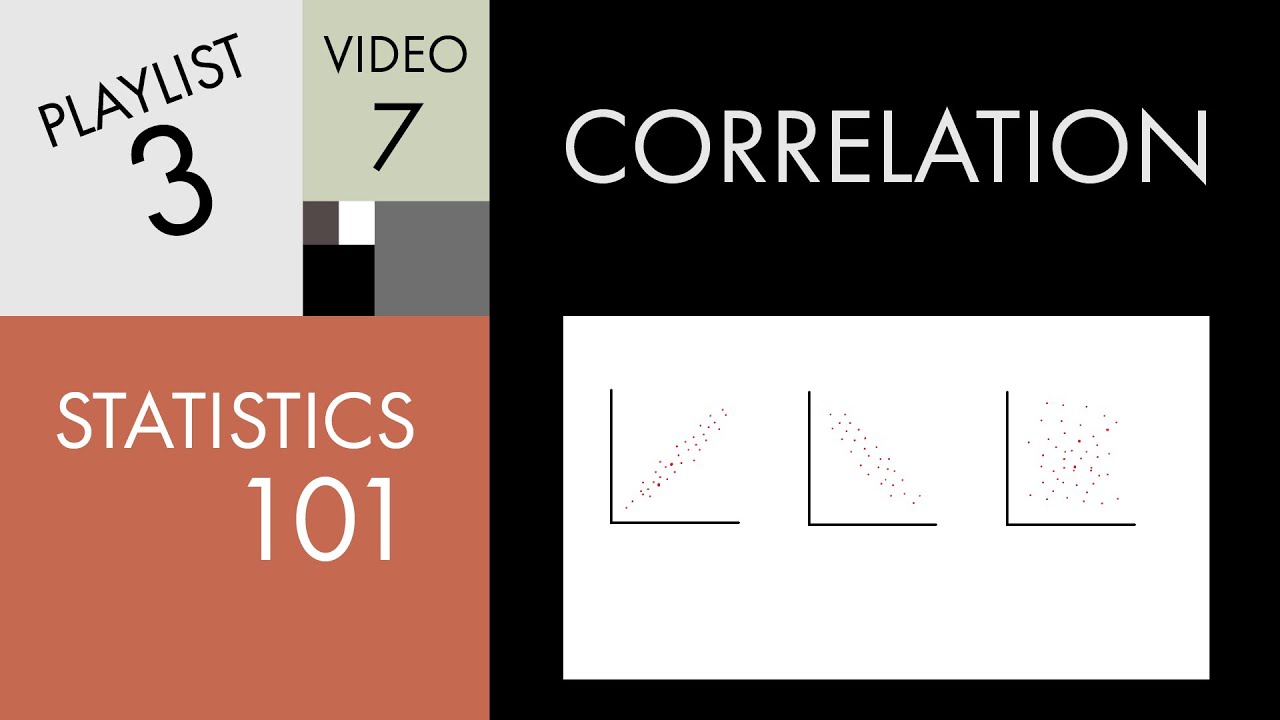
Statistics 101: Understanding Correlation
Statistics made easy ! ! ! Learn about the t-test, the chi square test, the p value and more
Quantitative Data Analysis 101 Tutorial: Descriptive vs Inferential Statistics (With Examples)
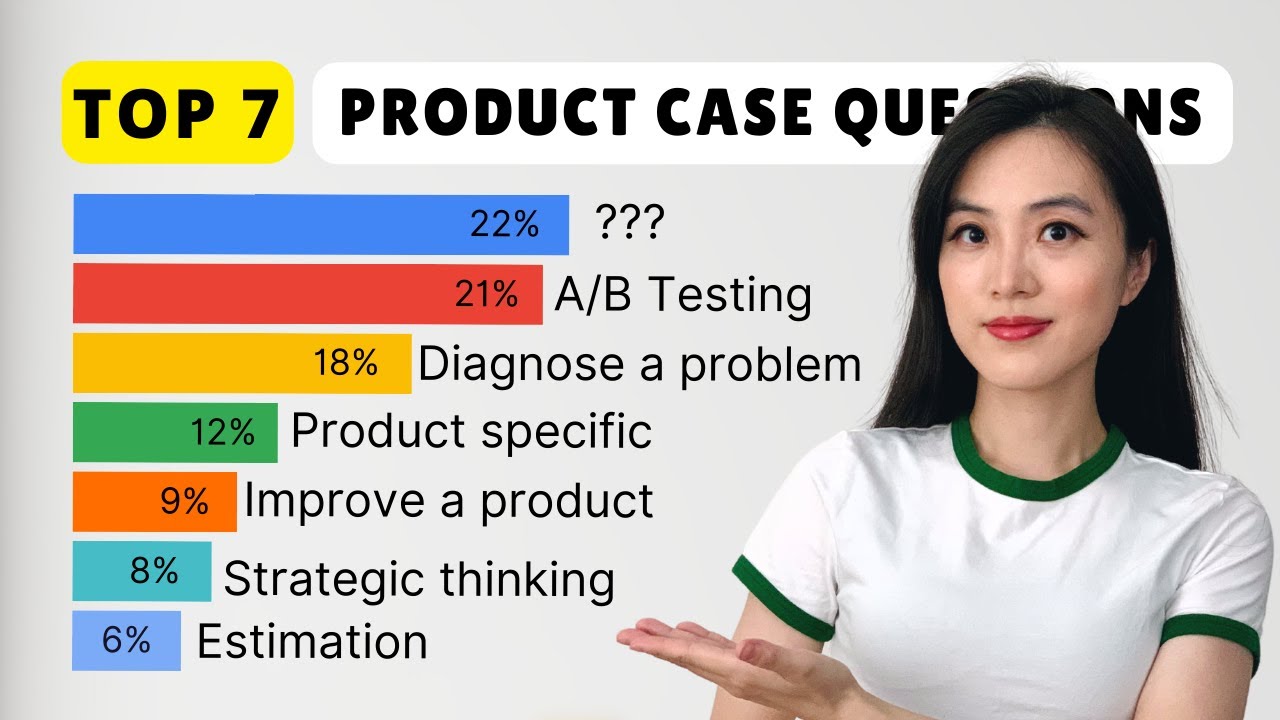
Ace Product/Business Case Interview Questions: A Data-driven Approach for Data Scientists
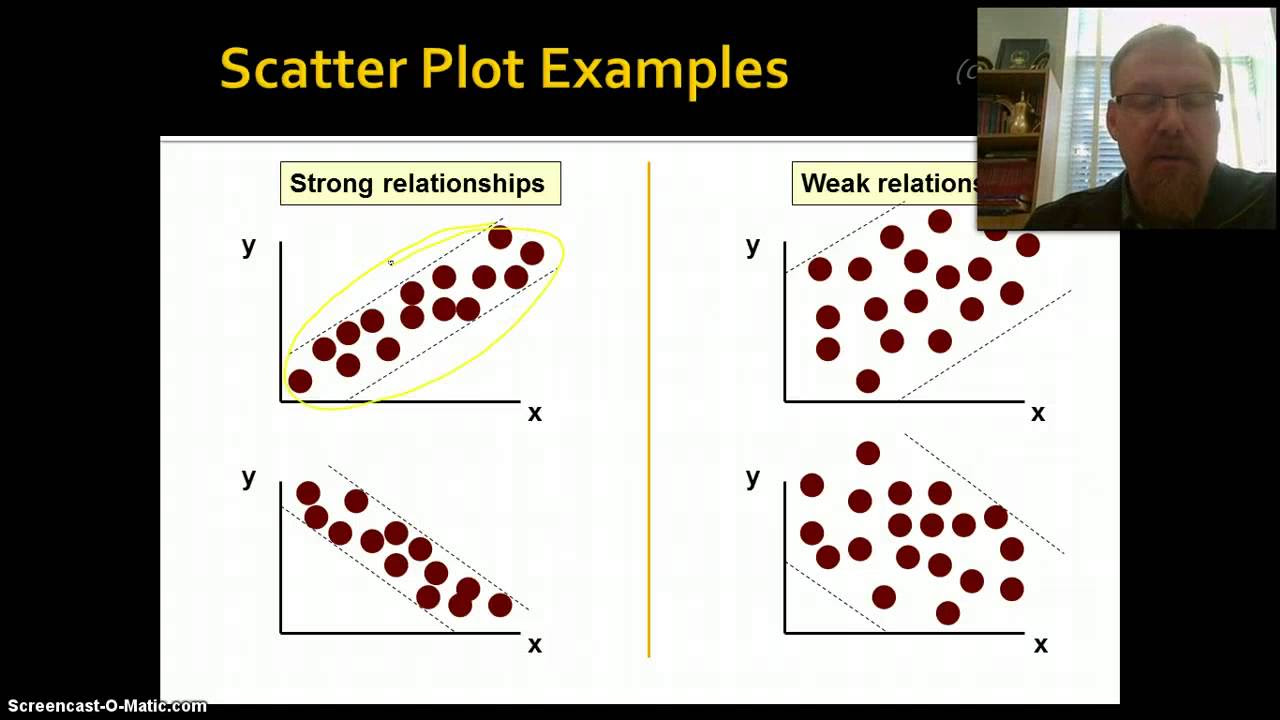
Introduction to Correlation & Regression, Part 1
5.0 / 5 (0 votes)
Thanks for rating: