6.2.3 Nonstandard Normal Distributions - Given areas or probabilities, find a range of x values.
TLDRThis video script offers a comprehensive guide on finding x-values for a continuous random variable with a normal distribution, given certain probabilities or areas. It emphasizes the importance of graphing, avoiding confusion between z-scores and areas, and choosing the correct side of the graph. The tutorial also explains how to use Excel's norm.inv function and z-tables to find z-scores and convert them back to x-values, illustrated with an example involving the 95th percentile of women's heights for U.S. Air Force pilot requirements.
Takeaways
- 📊 Start by graphing the normal distribution and labeling any given information to visualize and work with normal probability distributions.
- 🔍 Be cautious not to confuse z-scores with areas; z-scores represent distances from the mean in standard deviations, while areas represent regions under the probability density function.
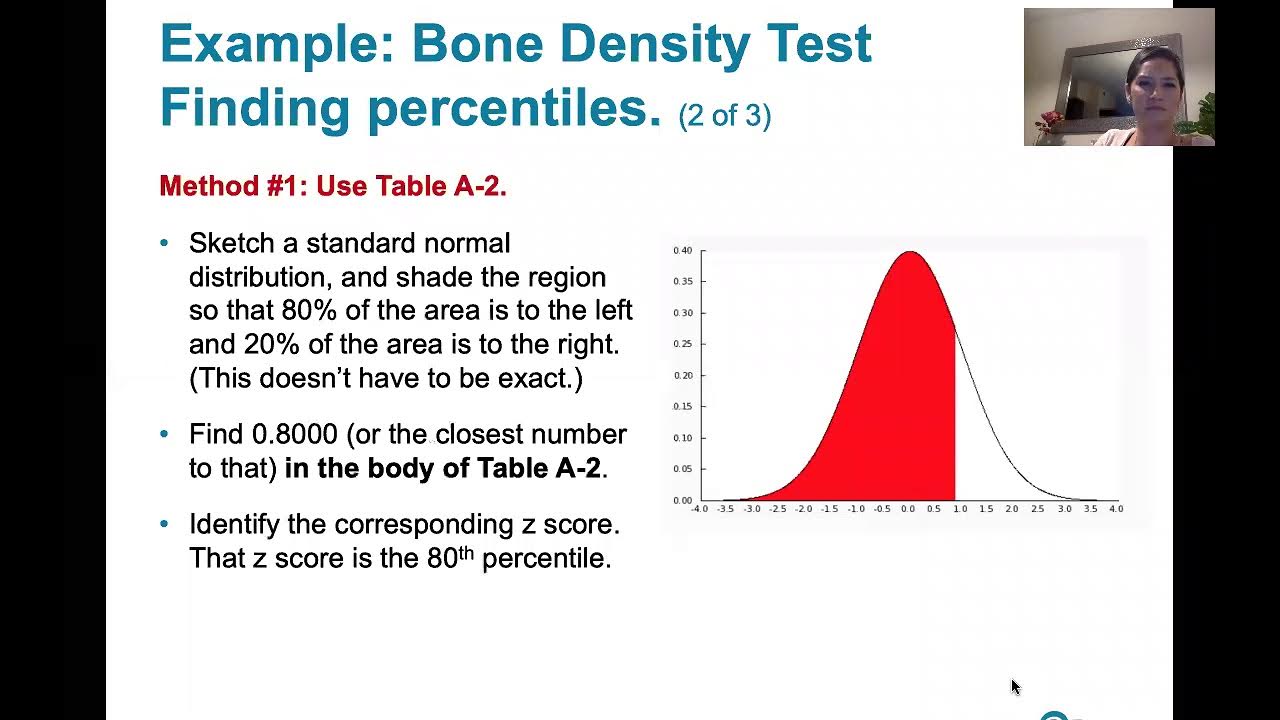
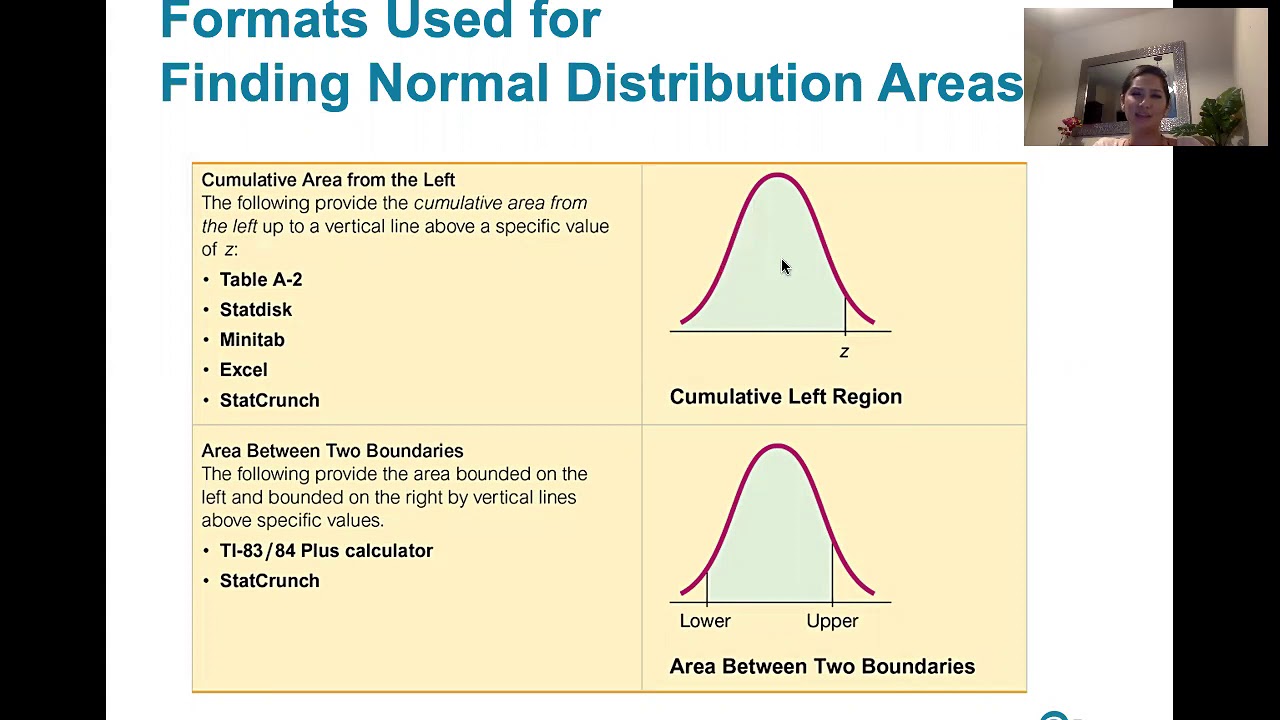
- 📚 Use the correct part of the z-table for the given information: z-scores are on the outside edge, and areas are in the body of the table.
- ➡️ Choose the correct side of the graph based on keywords in the problem statement to determine whether you're looking for a value on the left or right side of the distribution.
- ⏲ Remember that z-scores must be negative on the left half and positive on the right half of the normal distribution, corresponding to values below or above the mean, respectively.
- 🔢 Probabilities and areas are always between 0 and 1, and they are never negative; a negative or value greater than one indicates a potential error.
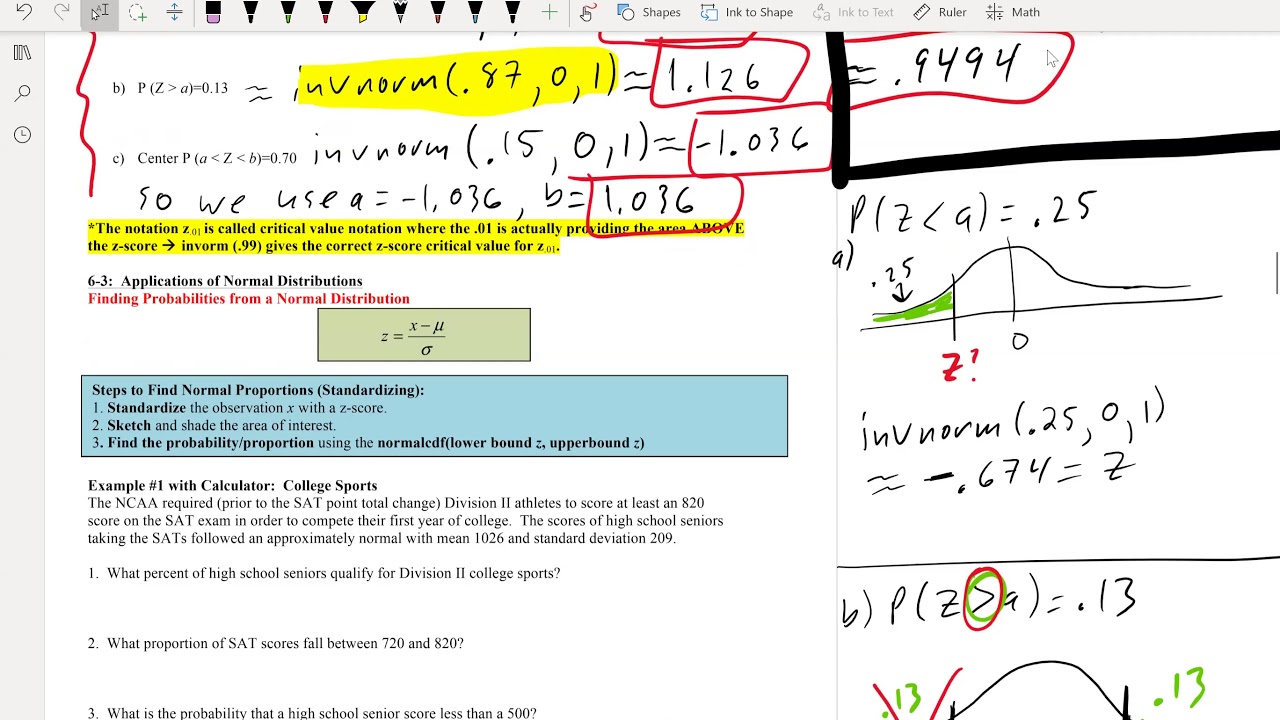
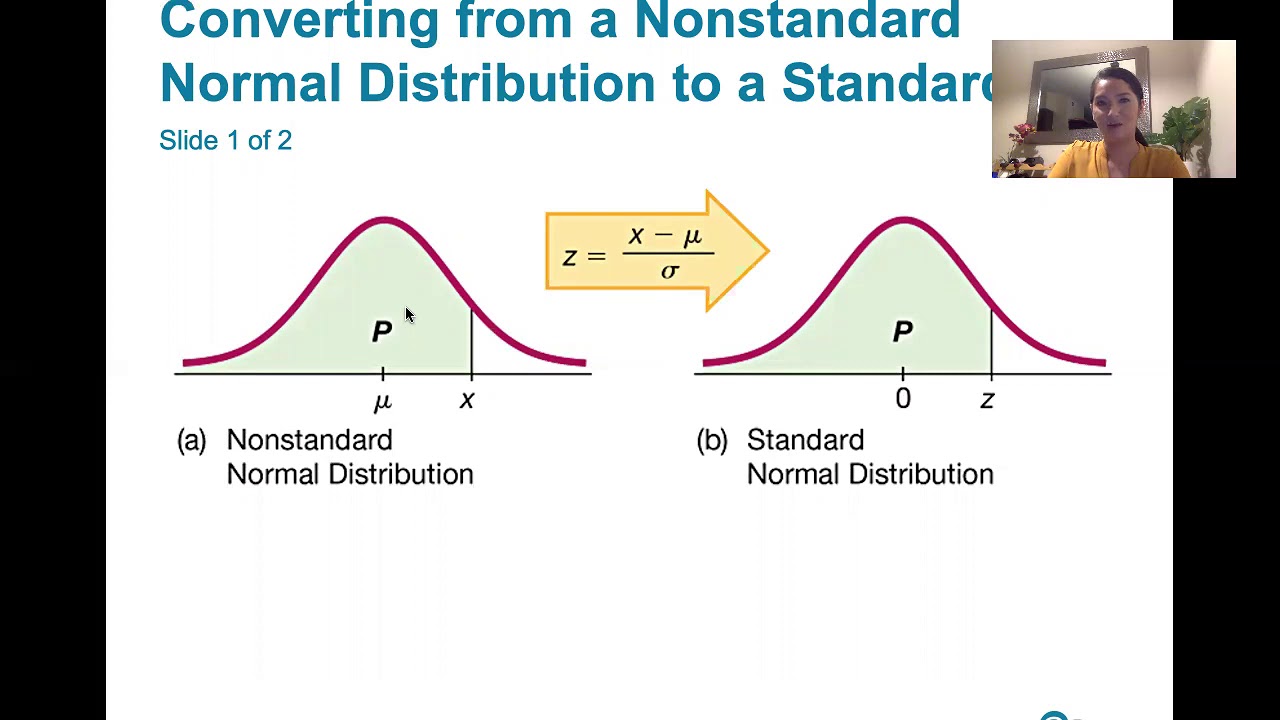
- 🔄 When converting from a non-standard normal distribution to a standard normal distribution, use the formula z = (x - mean) / standard deviation.
- 🔄 To convert back from a standard normal distribution to a non-standard normal distribution, rearrange the formula to solve for x: x = mean + z * standard deviation.
- 🛠 Use Excel's NORM.INV function to find the x value corresponding to a given area to the left, inputting the probability, mean, and standard deviation.
- 📝 Check your work by ensuring all probabilities and areas are between 0 and 1, and that z-scores and x-values correspond correctly to their positions relative to the mean.
- 📈 In context problems, like determining the maximum height for a group, graph the distribution, find the z-score for the desired percentile, and convert it back to an x-value to find the solution.
Q & A
What is the main focus of the lesson 6.2 video?
-The lesson 6.2 video focuses on finding a range of x values for a continuous random variable that is normally distributed, given certain areas or probabilities.
Why is it important to draw a picture when dealing with normal probability distributions?
-Drawing a picture is important because it helps in visualizing, understanding, and successfully working with normal probability distributions by graphing the distribution and labeling relevant information.
What is a common mistake students make when solving problems in lesson 6.1 and 6.2?
-A common mistake is confusing z-scores with areas. Z-scores are distances along the horizontal scale, while areas are regions under the probability density function.
How can you find the z-score corresponding to a given area using Excel?
-You can use the Excel function 'NORM.INV' which is the inverse of the normal distribution function. It requires the probability or area to the left, the mean, and the standard deviation as inputs.
What does the 'NORM.INV' function in Excel return?
-The 'NORM.INV' function in Excel returns the x value corresponding to the given probability or area to the left, mean, and standard deviation of a normal distribution.
How can you find the z-score corresponding to a given area using Table A2?
-In Table A2, you look for the given area in the body of the table to find the corresponding z-score on the outside edge, making sure to follow any special notations like asterisks that indicate common areas.
Why is it essential to choose the correct side of the graph when finding z-scores?
-Choosing the correct side of the graph is essential because it aligns with the keywords in the problem statement, ensuring that you are finding the right z-scores that correspond to the correct areas of the distribution.
What is the significance of the mean in the context of a normal distribution graph?
-The mean is significant because it serves as the central point of the normal distribution graph, helping to determine whether an x-value or a z-score is above or below the mean, which is crucial for interpreting the distribution correctly.
How can you convert a z-score back to an x-value in a non-standard normal distribution?
-You can convert a z-score back to an x-value using the formula x = mean + z * standard deviation, where z is the z-score.
What should you ensure when interpreting probabilities and areas in normal distributions?
-You should ensure that probabilities and areas are between 0 and 1, and they are never negative. This helps in identifying calculation errors or misinterpretations of z-scores and areas.
Can you provide an example of applying the concepts from the video to a real-world scenario?
-Yes, the video provides an example of determining the maximum acceptable height for women to be U.S. Air Force pilots, given that 95% of women should be eligible. By finding the 95th percentile of women's heights, which corresponds to a z-score of 1.645 and an x-value of 68.5 inches, it sets the height requirement.
Outlines
📊 Understanding Normal Distributions and Z-Scores
This paragraph introduces the learning outcome for finding x values in a normal distribution given certain probabilities or areas. It emphasizes the importance of graphing normal distributions to visualize and work with them effectively. The speaker advises labeling the graph with any given information, such as probabilities or x values, and shading the appropriate areas. The paragraph also clarifies the difference between z-scores and areas, explaining that z-scores represent distances from the mean, while areas represent regions under the probability density function. It advises students to refer to the correct part of the table when given a z-score or area and to choose the correct side of the graph based on the problem statement. The speaker also points out common mistakes, such as confusing z-scores with areas, and the importance of ensuring that probabilities and areas are between 0 and 1.
📚 Tips for Solving Normal Distribution Problems
The speaker provides a step-by-step procedure for finding x values from non-standard normal distributions, which involves sketching the normal curve, labeling given probabilities or areas, and shading the appropriate regions. They explain how to use Excel's NORM.INV function and Table A2 to find corresponding z-scores and x values. The paragraph highlights the importance of ensuring that the z-score is positive when the x-value is above the mean and negative when below, and vice versa. It also stresses the need to check that all probabilities and areas are between 0 and 1 and to use keywords in the problem statement to determine the correct side of the graph for the z-score. An example is given involving the heights of women and the U.S. Air Force pilot requirements, demonstrating how to find the 95th percentile height using the described methods.
🔍 Using Excel and Table A2 for Normal Distribution Analysis
This paragraph delves into the specifics of using Excel and Table A2 to find the x-value corresponding to a given area under the normal distribution curve. The speaker demonstrates how to use Excel's NORM.INV function to find the 95th percentile height for women, which would allow the shortest 95% to be pilots. They show the process of inputting the probability, mean, and standard deviation into the function and obtaining the x-value. The paragraph also explains how to use Table A2 to find the z-score corresponding to an area, emphasizing the need to look in the body of the table for the area and then finding the z-score on the outside edge. The speaker provides a detailed explanation of how to convert the z-score back to an x-value using a rearranged z-score formula and the importance of ensuring that the final answer makes sense in the context of the problem.
📉 Converting Known Areas to X Values in Normal Distributions
The speaker summarizes the process of converting known areas to x values in normal distributions, starting with graphing the region and finding the area to the left. They explain how to find the corresponding z-score using Table A2 by looking in the body of the table and then converting the z-score back to an x-value using the rearranged z-score formula. The paragraph reiterates the importance of checking that the final answer is contextually appropriate, ensuring that areas and probabilities are between 0 and 1, and that z-scores and x-values correspond correctly to their positions relative to the mean. The speaker concludes with an example of how changing the height requirement for U.S. Air Force pilots to 68.5 inches or less would allow 95% of women to be eligible, providing a practical application of the concepts discussed.
📈 Key Concepts in Normal Distribution Analysis
In the final paragraph, the speaker wraps up the lesson by emphasizing the key concept that the area bounded by a given x value in any normal distribution is the same as the area bounded by the corresponding z-score in the standard normal distribution. They explain that the process involves using the appropriate formulas to convert between a non-standard normal distribution and a standard normal distribution. The speaker also reminds learners that they can use the z-score formula to go from a standard normal distribution to a non-standard one, and vice versa. The lesson concludes with a reminder of the importance of understanding the relationship between areas, z-scores, and x-values in normal distribution analysis.
Mindmap
Keywords
💡Continuous Random Variable
💡Normal Distribution
💡Z-Score
💡Area Under the Curve
💡Probability Density Function (PDF)
💡Standard Deviation
💡Mean
💡Percentile
💡Excel Function (Norm.inv)
💡Table A2
Highlights
The video discusses finding x values for a continuous random variable with a normal distribution based on given areas or probabilities.
Suggests drawing a picture to visualize and work with normal probability distributions effectively.
Emphasizes the importance of graphing the normal distribution and labeling given probabilities or x-values.
Warns against confusing z-scores with areas, as z-scores are distances along the horizontal scale, not areas under the curve.
Clarifies that z-scores are on the outside edge of Table A2, while areas are found in the body of the table.
Advises on choosing the correct side of the graph for the problem based on keywords like 'top' or 'bottom' percent.
Explains that z-scores must be negative on the left half and positive on the right half of the normal distribution.
Reminds that probabilities and areas are always between 0 and 1, and should not be negative.
Describes the procedure for finding values from non-standard normal distributions, including sketching, shading, and using technology or Table A2.
Demonstrates using Excel's NORM.INV function to find the x value corresponding to a given area.
Shows how to find the corresponding z-score using Table A2 and the significance of the asterisk for common areas like 95%.
Illustrates converting a z-score back to an x-value using a rearranged z-score formula.
Stresses the importance of confirming that the answer makes sense in the context of the problem.
Presents an example of finding the maximum acceptable height for women pilots based on a normal distribution of heights.
Uses the example to show the process of converting areas to x values in a non-standard normal distribution.
Concludes with the result that a height requirement of 68.5 inches or less would allow 95% of women to be eligible for air force pilots.
Summarizes the lesson by reiterating the steps to convert from known areas to known x values in normal distributions.
Transcripts
Browse More Related Video
6.1.5 Standard Normal Distribution - z scores Corresponding to Areas. Percentiles. Critical Values.
6.1.4 The Standard Normal Distribution - Given a range of z scores, find areas or probabilities.

Elementary Stats Lesson #11
Math 119 Chap 6 part 2
6.2.1 Nonstandard Normal Distributions -Converting B/t Standard and Nonstandard Normal Distributions
6.2.0 Nonstandard Normal Distributions - Lesson Overview, Learning Outcomes, Key Concepts
5.0 / 5 (0 votes)
Thanks for rating: