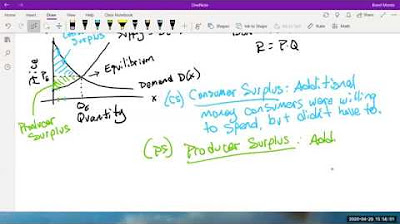
Calculating the Change in Consumer Surplus
TLDRIn this agribusiness video with Dr. G, the concept of consumer surplus is explored through the lens of a trapezoidal area calculation. The video demonstrates how to calculate the change in consumer surplus using a simple formula involving price changes and quantity demanded. Two examples are provided: one where a price decrease leads to an increase in consumer surplus, making consumers better off, and another where a price increase results in a decrease in consumer surplus, indicating consumer dissatisfaction. The visual diagrams and step-by-step explanations make the economic principle accessible and understandable.
Takeaways
- 📚 The video is about calculating the change in consumer surplus using a trapezoid area formula.
- 📐 The formula for the change in consumer surplus is given as -0.5 * (p2 - p1) * (q1 + q2), where p1 and p2 are the initial and final prices, and q1 and q2 are the corresponding quantities.
- 📉 The negative sign in the formula accounts for the downward slope of the demand curve, indicating that as price decreases, consumer surplus increases.
- 📈 The first example demonstrates a price decrease from $6 to $3, resulting in an increase in consumer surplus by $375.
- 😃 The first example shows that consumers benefit when prices drop, as they can buy more at a lower cost, leading to a positive change in consumer surplus.
- 📊 The second example features a price increase from $10 to $20, which is expected to result in a decrease in consumer surplus due to higher prices and lower quantities demanded.
- 😞 The second example illustrates that consumers are worse off when prices rise, as they pay more and buy less, leading to a negative change in consumer surplus.
- 🔢 In both examples, the change in consumer surplus is calculated by plugging the given prices and quantities into the formula and emphasizing the importance of correctly handling the signs.
- 📉 The video uses market diagrams to visually represent the change in consumer surplus, with the trapezoid representing the area of interest.
- 📝 The script emphasizes the importance of understanding the relationship between price changes and consumer surplus, and how it affects consumer welfare.
- 👨🏫 Dr. G, the presenter, provides step-by-step instructions on how to apply the formula to calculate the change in consumer surplus in different scenarios.
Q & A
What is the formula for calculating the change in consumer surplus?
-The formula for calculating the change in consumer surplus is the negative one-half times the price change (p2 - p1) multiplied by the sum of the two quantities (q1 + q2).
Why is there a negative sign in the formula for the change in consumer surplus?
-The negative sign in the formula accounts for the fact that the demand curve slopes downward, meaning that as price decreases, consumer surplus increases, and vice versa.
How does the change in price affect consumer surplus?
-A decrease in price increases consumer surplus, making consumers better off, while an increase in price decreases consumer surplus, making consumers worse off.
What does the area of the trapezoid in the market diagram represent?
-The area of the trapezoid in the market diagram represents the change in consumer surplus resulting from a change in price.
What is the significance of the demand curve always sloping downward?
-The downward slope of the demand curve signifies that as the price of a good or service decreases, the quantity demanded by consumers increases, which is a fundamental concept in economics.
In the first example, what was the initial price (p1) and the corresponding quantity (q1)?
-In the first example, the initial price (p1) was $6, and the corresponding quantity (q1) was 100.
In the first example, what was the new price (p2) and the corresponding quantity (q2)?
-In the first example, the new price (p2) was $3, and the corresponding quantity (q2) was 150.
What was the calculated change in consumer surplus in the first example?
-In the first example, the calculated change in consumer surplus was a gain of $375.
In the second example, what was the initial price (p1) and the corresponding quantity (q1)?
-In the second example, the initial price (p1) was $10, and the corresponding quantity (q1) was 100.
In the second example, what was the new price (p2) and the corresponding quantity (q2)?
-In the second example, the new price (p2) was $20, and the corresponding quantity (q2) was 10.
What was the calculated change in consumer surplus in the second example?
-In the second example, the calculated change in consumer surplus was a loss of $550, indicating that consumers were worse off due to the price increase.
Outlines
📊 Calculating Consumer Surplus Change with a Trapezoid Formula
In this educational video, Dr. G introduces the concept of calculating the change in consumer surplus using the area of a trapezoid as a metaphor. The formula for the change in consumer surplus is presented as negative one-half times the price change (p2 - p1) multiplied by the sum of the quantities demanded at the two different prices (q1 + q2). Dr. G emphasizes the importance of the downward sloping demand curve and its negative slope, which is crucial for understanding the formula's negative sign. The example provided involves a price drop from $6 to $3, resulting in a positive change in consumer surplus, calculated to be $375. This indicates that consumers are better off due to the price decrease, as they can buy more at a lower cost, which is graphically represented by a happy face on the diagram.
😞 Demonstrating Decrease in Consumer Surplus with Price Increase
The second paragraph of the script discusses a scenario where the price increases from $10 to $20, leading to a decrease in consumer surplus. Dr. G explains that when the price goes up, consumers are less happy, which is reflected in a negative change in consumer surplus. The trapezoid area between the two prices and to the left of the demand curve represents the change in consumer surplus. The formula is applied with the new numbers, resulting in a negative outcome of -$550, indicating that consumers are worse off due to the price increase. They are paying more and buying less, leading to less utility and happiness. The summary concludes with a visual representation of a frowny face, symbolizing the consumers' dissatisfaction with the price change.
Mindmap
Keywords
💡Consumer Surplus
💡Trapezoid
💡Demand Curve
💡Price Change
💡Quantity
💡Formula
💡Market Diagram
💡Negative Slope
💡Economic Welfare
💡Graphical Analysis
💡Multiplier
Highlights
Introduction to calculating the change in consumer surplus using the area of a trapezoid formula.
Explanation of the formula for change in consumer surplus involving price change and quantity demanded.
Importance of the negative slope of demand curves in the formula application.
Demonstration of how to apply the formula with given numerical values for price and quantity.
Graphical representation of consumer surplus change on a market diagram.
Shading the area of interest (trapezoid) between two prices on the demand curve.
Calculation of the change in consumer surplus resulting in a positive value, indicating consumer gain.
Interpretation of the positive result as an increase in consumer surplus and consumer happiness.
Introduction of a second example with a different price and quantity scenario.
Expectation of a negative result due to an increase in price leading to decreased consumer surplus.
Calculation of the change in consumer surplus resulting in a negative value, indicating consumer loss.
Interpretation of the negative result as a decrease in consumer surplus and consumer unhappiness.
Emphasis on the importance of understanding the direction of price changes and their impact on consumer surplus.
Visual representation of consumer sentiment with a smiley face for positive surplus and a frowny face for negative.
Conclusion summarizing the method of calculating the change in consumer surplus and its implications.
Transcripts
Browse More Related Video
5.0 / 5 (0 votes)
Thanks for rating:


