Binomial Distribution EXPLAINED in UNDER 15 MINUTES!
TLDRThis video script introduces the concept of the binomial distribution, using a coin toss example and a real-world scenario involving color blindness in men. It explains the prerequisites for a binomial distribution, such as fixed number of trials and equal probability of success. The script guides viewers through calculating probabilities for various outcomes using the binomial formula, emphasizing its intuitive nature. It also covers how to use Excel's binomdist function for calculations and discusses the expected value and standard deviation of the distribution, providing a comprehensive overview of binomial distribution applications in statistics.
Takeaways
- 🎓 The video is a tutorial on probability distributions, starting with the binomial distribution.
- 🔄 The binomial distribution is introduced with a coin toss example, illustrating the concept of probability in a simple scenario.
- 🧬 The script uses a real-world example of color blindness in men to explain the binomial distribution in a practical context.
- ✅ The prerequisites for a binomial distribution are outlined: two potential outcomes per trial, a fixed number of trials, equal probability of success across trials, and independence of trials.
- 📊 The video explains the binomial probability formula in detail, emphasizing its intuitive nature rather than just applying it blindly.
- 📝 The script provides step-by-step calculations for different scenarios, such as the probability of all men being colorblind, none being colorblind, exactly two being colorblind, and at least two being colorblind.
- 🔢 The concept of combinations is introduced to calculate the number of ways a certain outcome can occur, which is crucial for the binomial distribution calculations.
- 📉 The video demonstrates how to use the binomial distribution formula to calculate probabilities for discrete outcomes, such as the number of colorblind men in a sample.
- 📈 The script explains how to find the cumulative probability and how to use it to determine the probability of an event occurring at least a certain number of times.
- 📊 Excel's BINOMDIST function is introduced as a tool for calculating binomial probabilities, both for individual outcomes and cumulative probabilities.
- 🧐 The expected value and standard deviation of the binomial distribution are calculated, providing insight into the mean and spread of the distribution.
Q & A
What is the binomial distribution?
-The binomial distribution is a probability distribution that describes the number of successes in a fixed number of independent Bernoulli trials with the same probability of success.
What are the prerequisites for a binomial distribution?
-The prerequisites for a binomial distribution are two potential outcomes per trial (success or failure), a fixed number of trials, equal probability of success across all trials, and independence of trials.
What is the example used in the script to explain the binomial distribution?
-The script uses the example of tossing a coin 10 times and counting the number of heads, as well as a scenario involving color blindness in a sample of 10 men.
What is the probability of success in the color blindness example?
-In the color blindness example, the probability of success (having color blindness) is 8%, represented as p = 0.08.
How many men are in the sample used in the color blindness example?
-There are 10 men in the sample used in the color blindness example, represented as n = 10.
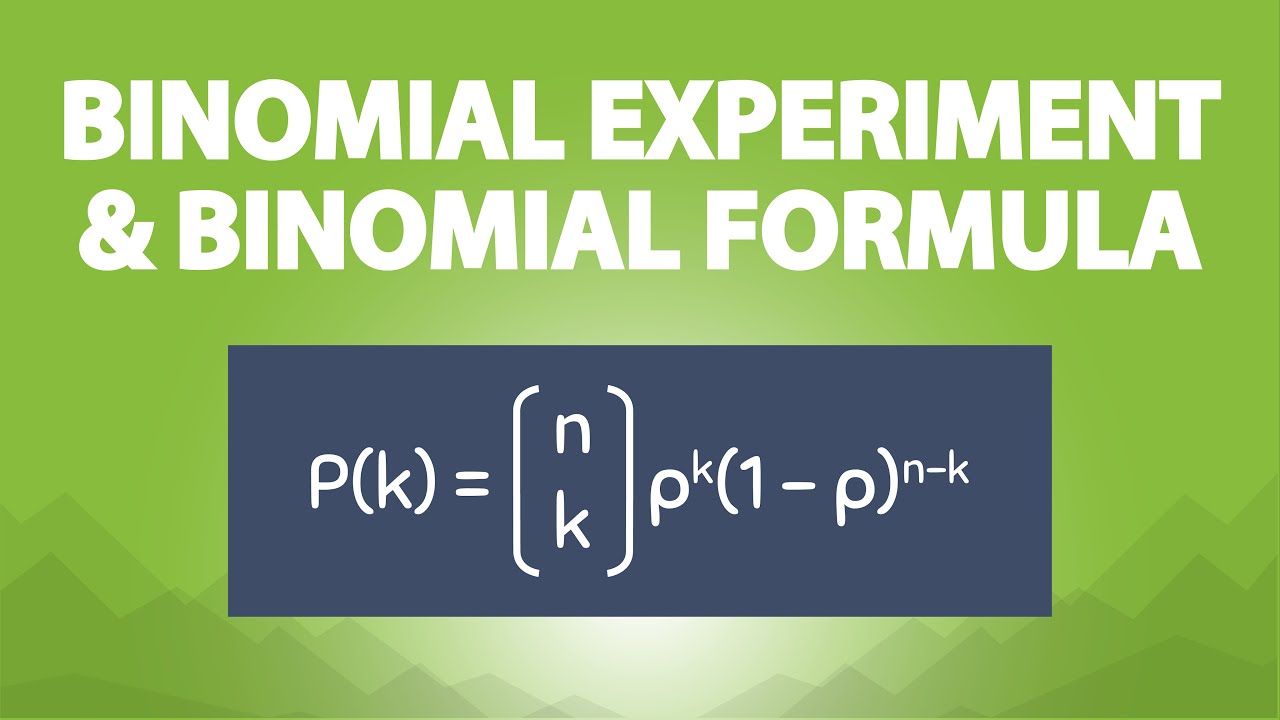
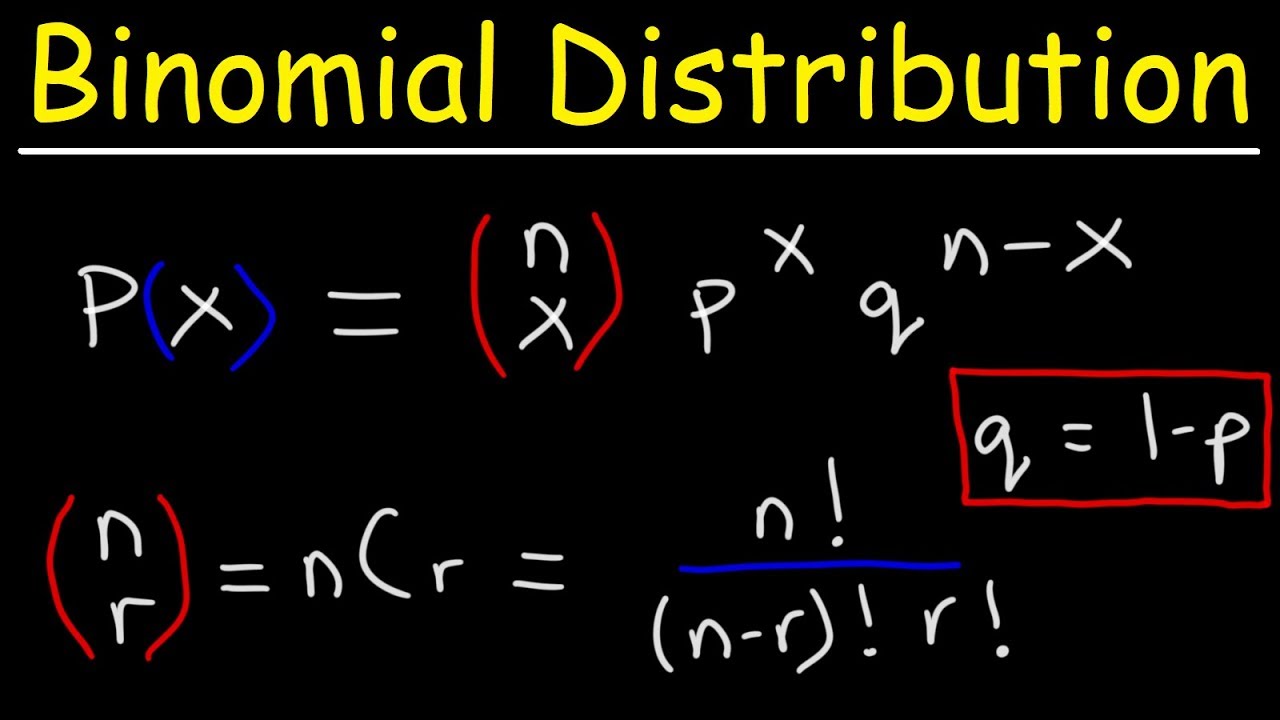
What is the formula for calculating the probability of a specific outcome in a binomial distribution?
-The formula for calculating the probability of a specific outcome (x successes) in a binomial distribution is P(X = x) = (nCx) * (p^x) * ((1-p)^(n-x)), where nCx is the number of combinations of n items taken x at a time, p is the probability of success, and (1-p) is the probability of failure.
What is the probability that all 10 men in the sample are colorblind?
-The probability that all 10 men are colorblind is calculated as (0.08)^10, which is approximately 1.07 * 10^-7, indicating it is very unlikely.
What is the probability that no men in the sample are colorblind?
-The probability that no men are colorblind is calculated as (0.92)^10, which is approximately 0.434.
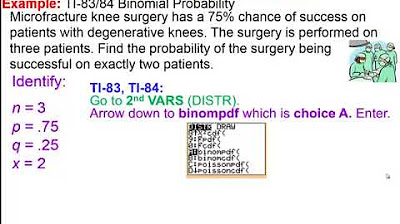
How can you calculate the probability of exactly two men being colorblind in the sample?
-The probability of exactly two men being colorblind is calculated using the binomial probability formula with x = 2, which involves the combination function 10C2, and the probabilities (0.08)^2 and (0.92)^8, resulting in approximately 0.148.
What is the expected number of colorblind men in the sample?
-The expected number of colorblind men in the sample is calculated as n * p, which in this case is 10 * 0.08, resulting in 0.8.
How can you find the standard deviation of the number of colorblind men in the sample?
-The standard deviation is found by taking the square root of the variance, which for a binomial distribution is calculated as the square root of (n * p * (1 - p)), resulting in approximately 0.858.
How can Excel's BINOMDIST function be used to find the probability of a specific outcome in a binomial distribution?
-Excel's BINOMDIST function can be used by providing the number of successes (x), the number of trials (n), the probability of success (p), and setting the cumulative argument to FALSE for individual probabilities or TRUE for cumulative probabilities.
What is the probability of at least two men being colorblind in the sample?
-The probability of at least two men being colorblind can be found by subtracting the probabilities of zero and one colorblind men from 1, or by using the cumulative distribution function in Excel with the appropriate parameters and setting the cumulative argument to TRUE.
Outlines
🎲 Introduction to Binomial Distribution
This paragraph introduces the concept of the binomial distribution through the classic example of a coin toss. It illustrates the distribution with the scenario of tossing a coin 10 times and predicting the number of heads. The presenter emphasizes the importance of understanding the components of the binomial distribution formula rather than just applying it. The example of color blindness in men is used to explain the prerequisites of a binomial distribution: fixed number of trials, two potential outcomes per trial, equal probability of success across trials, and independence of trials. The paragraph concludes with a challenge to the audience to calculate the probabilities of different outcomes using the binomial distribution formula.
📊 Calculating Binomial Probabilities
This paragraph delves into the process of calculating probabilities for different outcomes of the binomial distribution using the example of color blindness in a sample of 10 men. It explains the formula for binomial distribution and how to use it to find the probability of all men being color blind, none being color blind, exactly two being color blind, and at least two being color blind. The paragraph highlights the importance of considering all possible combinations for the latter and introduces the combinations function. It also demonstrates how to use the binomial distribution formula to calculate the probabilities for the given scenarios, emphasizing the intuitive nature of the calculations.
📈 Using Excel for Binomial Distribution Analysis
This paragraph discusses the use of Excel to simplify the calculations of binomial distribution probabilities. It introduces the BINOMDIST function in Excel, which can calculate the probability of a specific outcome or a range of outcomes within a binomial distribution. The paragraph explains how to use the function for both individual probabilities and cumulative probabilities, providing examples of how to input the necessary parameters such as the number of trials, the probability of success, and whether the calculation should be cumulative. It also touches on the concept of expected value and standard deviation within the context of a binomial distribution, using the color blindness example to illustrate how to calculate these statistical measures.
Mindmap
Keywords
💡Binomial Distribution
💡Probability
💡Success
💡Trial
💡Independence
💡Combination
💡Cumulative Distribution Function (CDF)
💡Expected Value
💡Variance
💡Standard Deviation
💡Excel Function
Highlights
Introduction to a series on probability distributions.
Starting with the binomial distribution using a coin toss example.
Explaining the binomial distribution formula and its intuitive nature.
Using a real-world scenario of color blindness in men to illustrate binomial distribution.
Prerequisites for a binomial distribution: two outcomes per trial and equal probability of success.
Calculating the probability of all 10 men being color blind.
Calculating the probability of no men being color blind.
The importance of combinations in calculating probabilities for certain outcomes.
Using the binomial distribution formula to calculate discrete outcomes.
Calculating the probability of exactly two men being color blind using the combinations function.
Using Excel's BINOMDIST function to find probabilities of discrete outcomes.
Understanding cumulative distribution functions and their application in Excel.
Calculating the probability of at least two men being color blind.
Assessing the expected number of color blind men in the sample using the expected value formula.
Calculating the standard deviation of the number of color blind men in the sample.
Conclusion of the first lesson in a series on distributions with a teaser for upcoming content.
Transcripts
Browse More Related Video

Math 119 Chapter 5 part 2
The Binomial Experiment and the Binomial Formula (6.5)
Finding The Probability of a Binomial Distribution Plus Mean & Standard Deviation
Elementary Statistics - Chapter 5 Binomial Distributions Part 2
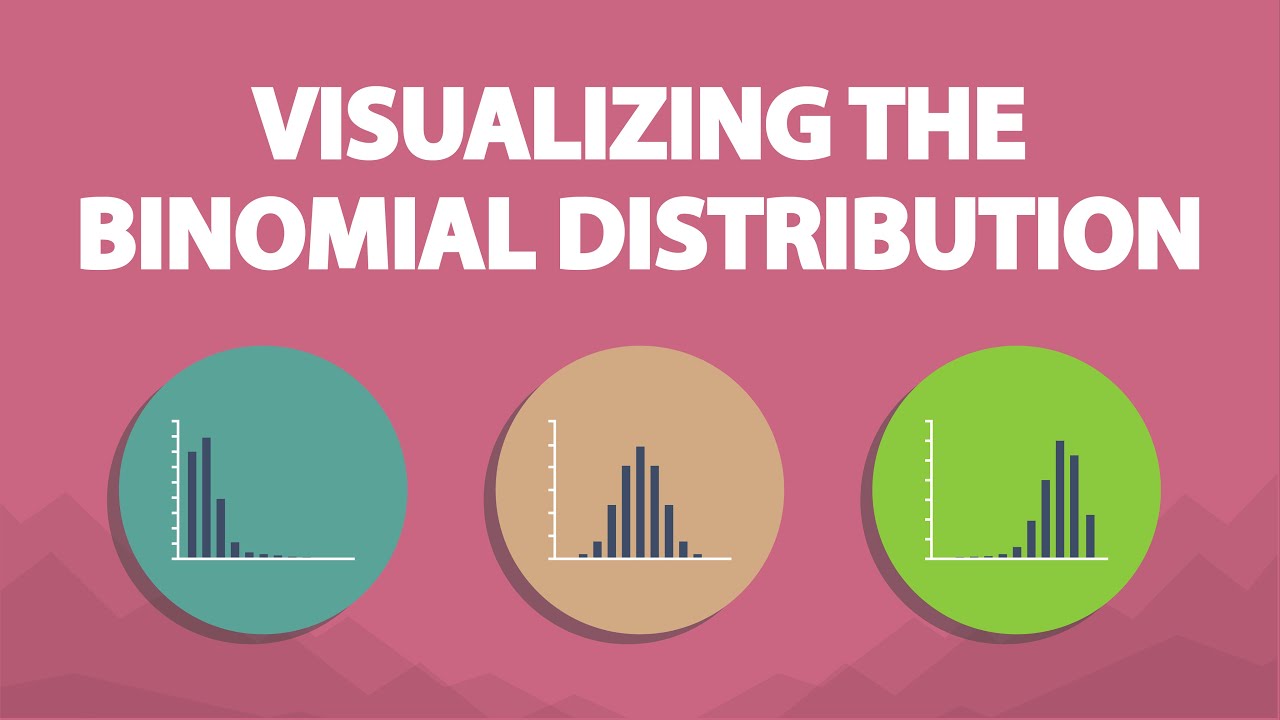
Visualizing the Binomial Distribution (6.6)
Statistics 101: The Binomial Distribution
5.0 / 5 (0 votes)
Thanks for rating: