Statistics 101: The Binomial Distribution
TLDRThis video delves into the binomial distribution, a fundamental concept in statistics and finite mathematics. The presenter uses salesperson performance as an example to illustrate the binomial experiment's characteristics, such as fixed trials, two exclusive outcomes, constant probabilities of success, and independence of trials. The script guides viewers through calculating probabilities of specific outcomes, emphasizing the importance of understanding both the number of trials and success rates in determining the likelihood of various results, making it an insightful resource for those new to the subject.
Takeaways
- 📚 The video is part of a series on basic statistics, covering topics relevant to both stats and finite math courses.
- 🗣️ The speaker encourages viewers to stay positive, especially if they're struggling in class, emphasizing that hard work and persistence can overcome challenges.
- 🔔 The channel and social media accounts are mentioned as platforms to follow for updates on new video content.
- 👍 The speaker asks viewers to like the video if they find it helpful and to leave constructive comments for improvement.
- 📈 The binomial distribution is introduced as a specific type of discrete probability distribution, characterized by a finite number of outcomes, typically whole numbers.
- 👩💼 An example involving salespeople's performance is used to illustrate the concept of the binomial distribution, focusing on the number of successful sales calls made per day.
- 🔢 The binomial experiment is defined by its characteristics: a fixed number of trials, two exclusive outcomes (success/failure), a constant probability of success, and independent trials.
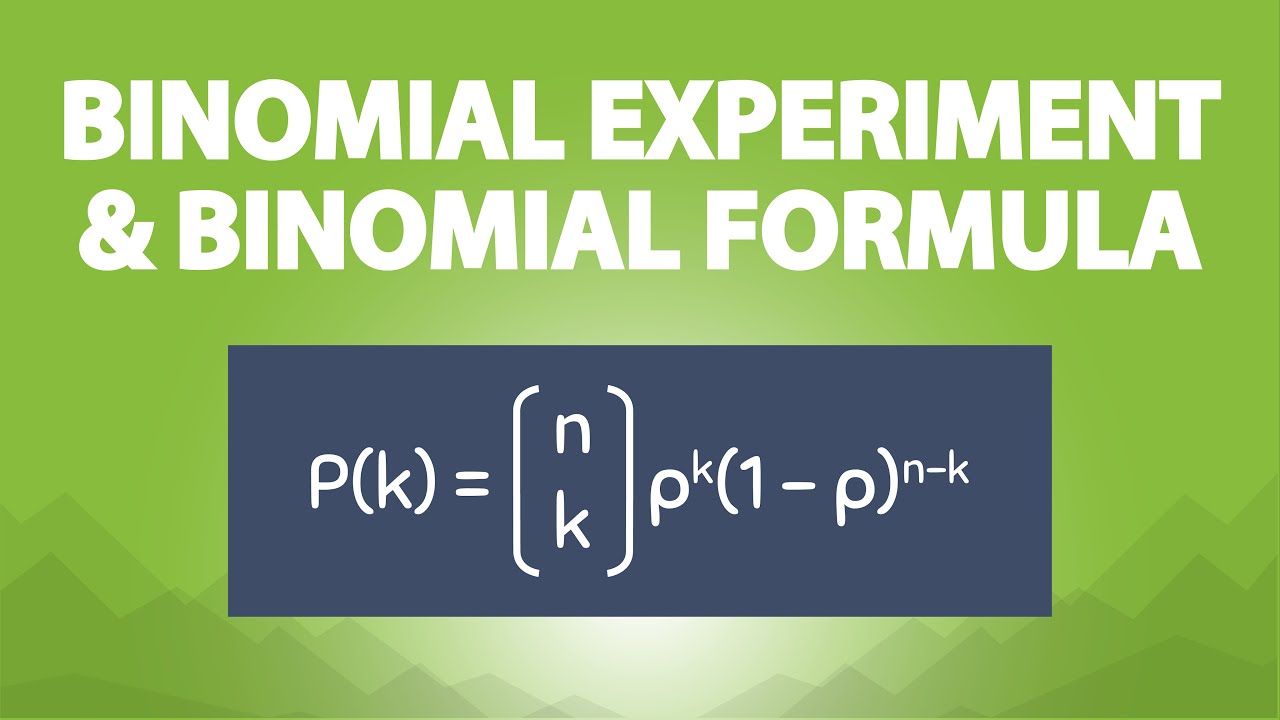
- 🎯 The binomial probability formula is explained, which combines the number of trials, the number of successes, and the probability of success to calculate the probability of a specific outcome.
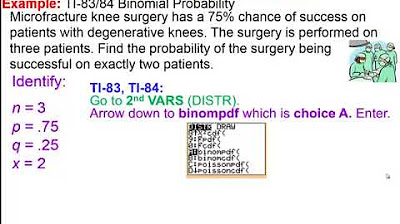
- 📉 A quality control example with a 20% defect rate is used to demonstrate how to apply the binomial distribution formula to real-world scenarios.
- 📊 The video concludes with a comparison of two salespeople, Joan and Margot, showing how the binomial distribution can be used to calculate the probability of making a certain number of sales in a day.
- 🌟 The importance of understanding both the number of trials and the success rate when calculating probabilities in a binomial distribution is highlighted.
Q & A
What is the main topic of the video?
-The main topic of the video is the binomial distribution, which is a specific type of discrete probability distribution taught in both statistics and finite mathematics courses.
What is a discrete probability distribution?
-A discrete probability distribution is a distribution where the outcomes are finite in number and are usually whole numbers, as opposed to continuous outcomes that can take on any value within a range.
What are the characteristics of a binomial experiment?
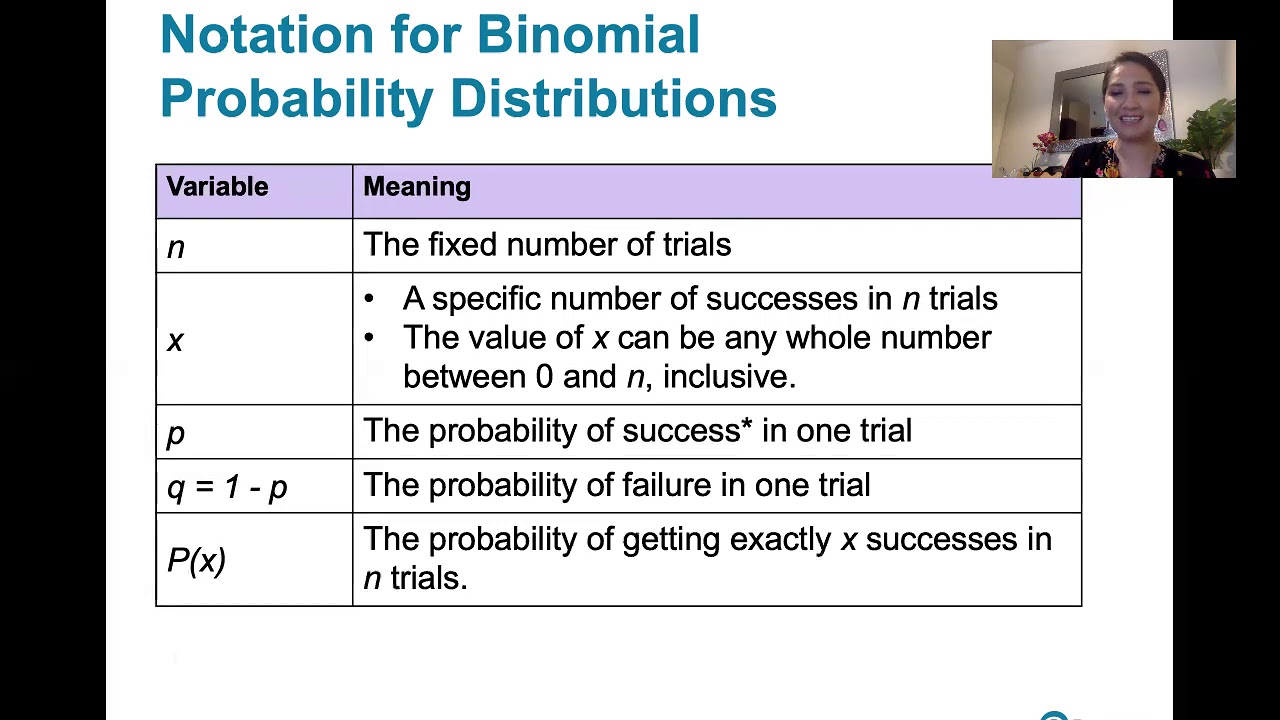
-A binomial experiment has the following characteristics: a fixed number of trials (n), only two exclusive outcomes (success or failure), a constant probability of success (p) that does not change from trial to trial, the independence of trials, and the outcomes are mutually exclusive.
What does the term 'success' represent in the context of a binomial experiment?
-In the context of a binomial experiment, 'success' represents the outcome of interest, which could be any characteristic or event being studied, and it does not necessarily imply a positive outcome.
Can you provide an example of a binomial experiment from the video?
-An example of a binomial experiment from the video is analyzing the performance of salespersons, specifically looking at the number of sales calls made and the number of successful sales per day.
What is the probability that Joan, with a 75% success rate and 10 calls per day, makes exactly six sales on any given day?
-The probability that Joan makes exactly six sales on any given day is calculated using the binomial distribution formula and is approximately 14.6%.
What is the probability that Margot, with a 45% success rate and 16 calls per day, makes exactly six sales on any given day?
-The probability that Margot makes exactly six sales on any given day is calculated using the binomial distribution formula and is approximately 16.8%.
Why might Margot have a higher probability of making six sales per day compared to Joan, despite having a lower success rate?
-Margot might have a higher probability of making six sales per day compared to Joan because she makes more calls per day (16 versus 10), which increases the likelihood of achieving a certain number of successes, even with a lower success rate.
How does the video script address the issue of students struggling with the material?
-The script encourages students who are struggling with the material to stay positive, keep their head up, and maintain faith in their ability to overcome challenges with hard work, patience, and practice.
What is the significance of the binomial distribution in quality control, as demonstrated in the video?
-The binomial distribution is significant in quality control as it helps in calculating the probability of a certain number of defective items in a sample, which is essential for assessing and maintaining product quality.
Outlines
📚 Introduction to Basic Statistics and Binomial Distribution
The video script begins with a motivational introduction to a series on basic statistics, specifically finite mathematics. The speaker encourages viewers facing difficulties in their studies to stay positive and offers support through the educational content. The script introduces the topic of the binomial distribution, applicable in both statistics and finite math courses. It sets the stage for an example involving salespersons' performance to illustrate the concept of discrete probability distributions, where outcomes are finite and typically whole numbers.
🔍 Understanding the Binomial Experiment and Its Characteristics
This paragraph delves into the specifics of a binomial experiment, which is characterized by a fixed number of trials, two exclusive outcomes (success or failure), a constant probability of success (p) across trials, and the independence of trials. The script clarifies that 'success' is not necessarily positive and provides an example involving sales calls to explain the concept further. It sets up the groundwork for calculating the probability of a certain number of successes in a given number of trials.
📈 The Binomial Distribution Formula and Its Application
The script introduces the binomial distribution formula, which is used to calculate the probability of a given number of successes in a fixed number of trials. It explains the components of the formula, including the number of trials (n), the number of successes (x), and the probability of success (p). The paragraph uses a practical example of a manufacturer with a 20% defect rate to illustrate how to apply the formula and calculate the probability of having exactly one defective item in a sample of five products.
📝 Calculating Individual Trial Probabilities and the Summation of Outcomes
The script continues with the example of the manufacturer, calculating the probability of different sequences of one defective item in five trials. It demonstrates how to multiply the probabilities of individual outcomes to find the probability of a specific sequence and how to use combinations to find the number of ways a certain number of successes can occur. The paragraph emphasizes that rearranging the outcomes does not change the overall probability of an event occurring.
📉 Discrete Probability Distribution Graph and Quality Control Example
The script presents a discrete probability distribution graph for the quality control example, showing the probability of selecting a certain number of defective items. It explains how the probabilities for different numbers of defective products are calculated using the binomial distribution formula and how they sum up to one, representing a complete set of possible outcomes. The graph visually represents the distribution of probabilities for the number of defective items found in the sample.
📝 Applying the Binomial Distribution to Salesperson Performance
The script applies the binomial distribution to the initial example of two salespersons, Joan and Margot, with different success rates and average numbers of sales calls per day. It uses the binomial distribution formula to calculate the probability of each salesperson making exactly six sales in a day, highlighting the interplay between success rate and the number of trials (calls).
📊 Comparing Salesperson Performance and the Impact of Trials and Success Rate
This paragraph compares the binomial distributions for Joan and Margot, showing how the number of trials and the success rate affect the probability of making a certain number of sales. It reveals a crossover point where Margot has a higher probability of making six sales due to her higher number of calls, despite a lower success rate. Conversely, Joan has a higher probability of making eight sales due to her higher success rate, demonstrating the dynamic relationship between these two factors.
🌟 Conclusion and Encouragement for Continuous Learning
The script concludes by summarizing the importance of understanding the binomial distribution and its applications in various fields, including business. It encourages viewers to stay positive, especially if they are facing challenges in their studies, and to continue learning and enjoying the process. The speaker expresses confidence in the viewers' ability to overcome difficulties and emphasizes the value of making an effort to improve oneself.
Mindmap
Keywords
💡Binomial Distribution
💡Discrete Probability Distribution
💡Success Rate
💡Sales Calls
💡Probability
💡Bernoulli Trials
💡Combination
💡Quality Control
💡Defect Rate
💡Independence
💡Productivity
Highlights
Introduction to the video series on basic statistics with a focus on binomial distribution, applicable to both stats and finite math courses.
Encouragement for viewers facing difficulties in class, emphasizing the importance of perseverance and self-belief.
Invitation to follow the channel on YouTube and Twitter for updates on new video uploads.
Request for feedback through likes and constructive comments to improve the quality of future videos.
Explanation of the binomial distribution as a discrete probability distribution with finite outcomes, often whole numbers.
Use of a salesperson performance example to illustrate the concept of binomial distribution.
Detailed breakdown of the binomial experiment characteristics, including fixed number of trials and two exclusive outcomes.
Clarification on the fixed probability of success and failure in binomial experiments, which remains constant across trials.
Emphasis on the importance of independence in trials, where outcomes of previous trials do not affect future ones.
Introduction of the binomial probability formula and its components: n (number of trials), x (number of successes), and p (probability of success).
Demonstration of calculating probabilities using the binomial distribution formula with a product defect rate example.
Illustration of how to apply the binomial distribution to find the probability of exactly six sales for two salespersons with different success rates and call volumes.
Comparison of the binomial distribution outcomes for Joan and Margot, showing how Margot's higher call volume compensates for her lower success rate.
Graphical representation of the binomial distribution for quality control, showing the probability of different numbers of defective items.
Revisiting the salesperson example to calculate the probability of making eight sales in a day, revealing a crossover point in success rates.
Conclusion highlighting the impact of both the number of trials and success rate on the binomial distribution outcomes.
Final encouragement for viewers to stay positive, seek knowledge, and enjoy the learning process.
Transcripts
Browse More Related Video
The Binomial Experiment and the Binomial Formula (6.5)

Binomial Distribution EXPLAINED in UNDER 15 MINUTES!
5.2.1 Binomial Probability Distributions - Is this procedure described by a binomial distribution?
Elementary Statistics - Chapter 5 Binomial Distributions Part 2

Math 119 Chapter 5 part 2
Probability: Binomial Distribution
5.0 / 5 (0 votes)
Thanks for rating: