Lecture 05: Visualizing the Derivative Slopes
TLDRThis lecture delves into the concept of derivatives in calculus, illustrating their graphical representation and significance in various contexts. The instructor explains how derivatives relate to the rate of change, using examples such as a car's motion, population growth, and stock market fluctuations. The focus then shifts to the relationship between a function's graph and its derivative, highlighting how the slope of the tangent line at any point on a curve equals the derivative at that point. The lecture also touches on acceleration as the second derivative and introduces the mean value theorem, which states that the instantaneous velocity at some point during a trip must equal the average velocity over that interval. Finally, a brief historical note on L'Hôpital's rule and a mention of different notations for derivatives by Newton and Leibniz are provided, concluding with the most common notation used today.
Takeaways
- 📚 The script introduces the concept of derivatives in calculus and their various manifestations, starting with their graphical representation.
- 🚗 It uses the example of a car moving on a straight road to explain how derivatives relate to change and motion, specifically the instantaneous velocity.
- 📈 The script discusses how graphs can represent different scenarios, including population growth and stock market trends, and how the steepness of the curve indicates the rate of change.
- 📊 The importance of the slope of a line in a graph is highlighted, as it corresponds to the velocity of the car (or rate of change) in the example given.
- 🔍 The concept of the derivative is further explored through the idea of a limiting process, where the slope of the tangent line at a point on a curve represents the instantaneous velocity.
- 🔄 The script explains that the derivative of a function at any point on a curve is equal to the slope of the tangent line at that point.
- 📉 The second derivative is introduced as the derivative of the first derivative, which can represent acceleration in the context of motion.
- 📚 The Mean Value Theorem is mentioned, which states that during a trip, the instantaneous velocity at some point must equal the average velocity over the trip.
- 👥 A brief history of calculus notations is provided, mentioning Newton's dot notation and Leibniz's fraction notation for derivatives.
- 📖 L'Hôpital's rule is mentioned as a theorem relating the limit of a ratio of derivatives to the limit of a ratio of functions, with a historical anecdote about its origin.
- 📝 The common notation of using a prime mark to denote the derivative of a function is highlighted as a standard practice in mathematics.
Q & A
What is the main focus of the lectures on calculus mentioned in the script?
-The main focus of the lectures is to explore the concept of the derivative in calculus, its relation to graphs, its algebraic perspective, and its application to real-world scenarios such as the motion of a car, population growth, and stock market trends.
What is the fundamental theorem of calculus and its significance in the lectures?
-The fundamental theorem of calculus is not explicitly defined in the script, but it typically relates to the connection between differentiation and integration. Its significance lies in providing a foundational understanding that allows for the exploration of derivatives in various contexts.
How does the script describe the relationship between the derivative and the graph of a function?
-The script describes the relationship by explaining that the slope of the tangent line to the graph of a function at any point is equal to the derivative of the function at that point. This relationship helps in understanding concepts like velocity and acceleration in the context of motion.
What is the physical interpretation of the first derivative as discussed in the script?
-The physical interpretation of the first derivative, as discussed in the script, is the instantaneous velocity of an object, such as a car moving down a straight road.
How is the concept of acceleration related to the derivative in the script?
-Acceleration is related to the derivative as it represents the second derivative of the position function. It measures how quickly the velocity of an object is changing, which is the rate of change of the first derivative.
What does the script say about the steepness of a graph and its relation to the rate of change?
-The script states that the steepness of a graph, or the slope of the curve, indicates how quickly the quantity represented on the y-axis is changing with respect to the quantity on the x-axis. A steeper slope corresponds to a higher rate of change.
Can you provide an example from the script that illustrates how to determine the instantaneous velocity of a car from its graph?
-The script provides an example where a car is moving on a straight road, and its position is plotted over time. To determine the instantaneous velocity, one would look at the slope of the tangent line to the graph at a specific point in time, which represents the derivative and thus the velocity at that moment.
What does the script imply about the relationship between a graph and real-world phenomena like the Chernobyl disaster?
-The script implies that graphs can be powerful tools for representing and understanding real-world events. For instance, the graph of the Chernobyl power plant's power output on the day of the disaster tells a compelling story of a sudden and dramatic increase in power output, indicating the critical event.
How does the script explain the concept of a limit in the context of derivatives?
-The script explains the concept of a limit in derivatives by describing the process of taking smaller and smaller time intervals (delta t) and examining the slope of the line between points on the graph. As delta t approaches zero, this slope approaches the value of the derivative, which is the instantaneous rate of change.
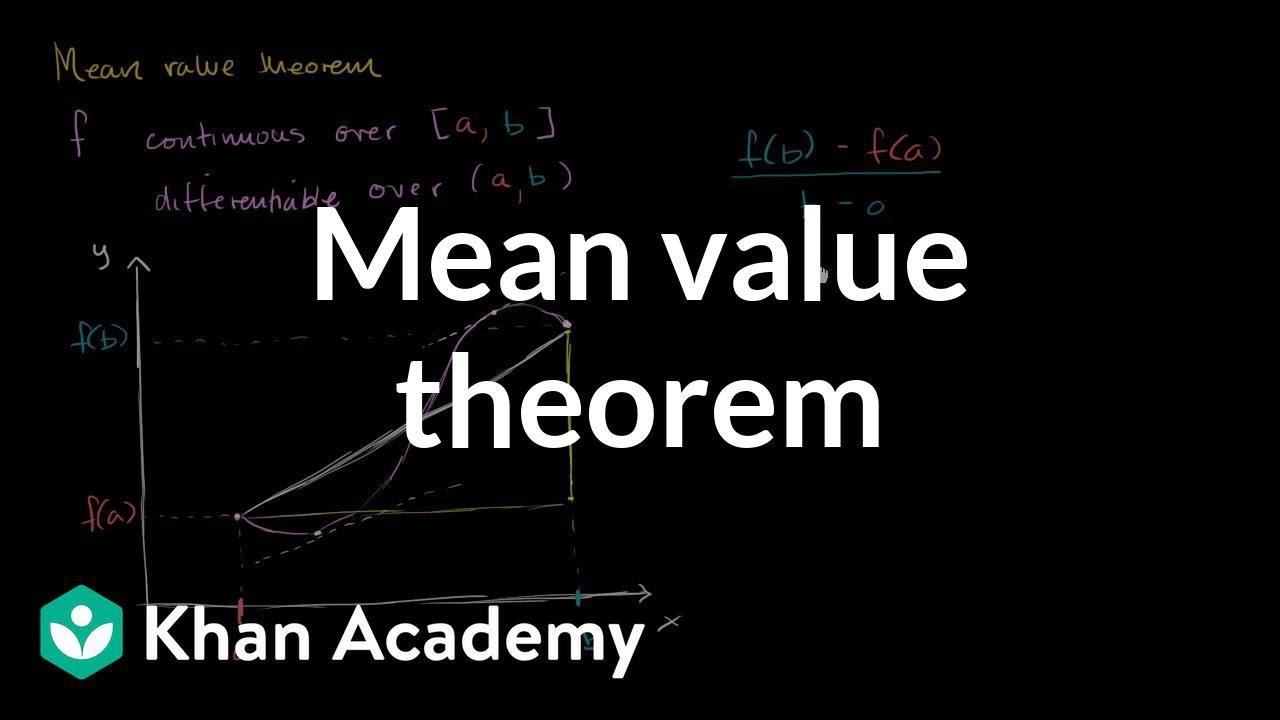
What is the Mean Value Theorem mentioned in the script, and how is it demonstrated graphically?
-The Mean Value Theorem, as mentioned in the script, states that if a function has a certain average velocity over an interval, then there must be at least one point within that interval where the instantaneous velocity equals the average velocity. Graphically, this is demonstrated by drawing a line from the starting point to the ending point of the function on the graph, determining the average velocity from the slope of this line, and then finding a point on the curve where the tangent line has the same slope.
Outlines
📚 Introduction to Derivatives in Calculus
This paragraph introduces the topic of derivatives within the broader context of calculus. The lecturer explains that derivatives and integrals are fundamental concepts in calculus, interconnected through the fundamental theorem of calculus. The purpose of the lecture series is to explore the derivative in depth, starting with its graphical relationship, followed by an algebraic perspective, and finally its application to real-world phenomena. The lecturer emphasizes the versatility of derivatives and integrals, highlighting their relevance in various scenarios, such as analyzing the motion of a car, population growth, stock market trends, and even the power output of a nuclear plant like Chernobyl. The importance of understanding change over time, particularly in relation to graphs, is underscored as a key concept in this lecture.
📈 Understanding Graphs and the Concept of Slope
The second paragraph delves into the analysis of graphs as a means to understand the relationship between two dependent quantities. The lecturer uses the example of a car moving along a straight road to illustrate how a graph can represent the car's position at different times. The concept of a function is introduced, where for every time there is a corresponding position. The paragraph explains how the direction of the graph's slope (upward or downward) can indicate the direction of the car's motion, and how the steepness of the slope can represent the speed of the car. The lecturer also discusses how to interpret different types of graphs, such as those showing constant speed, increasing speed, and varying speeds, by examining the slope of the line or curve at different points.
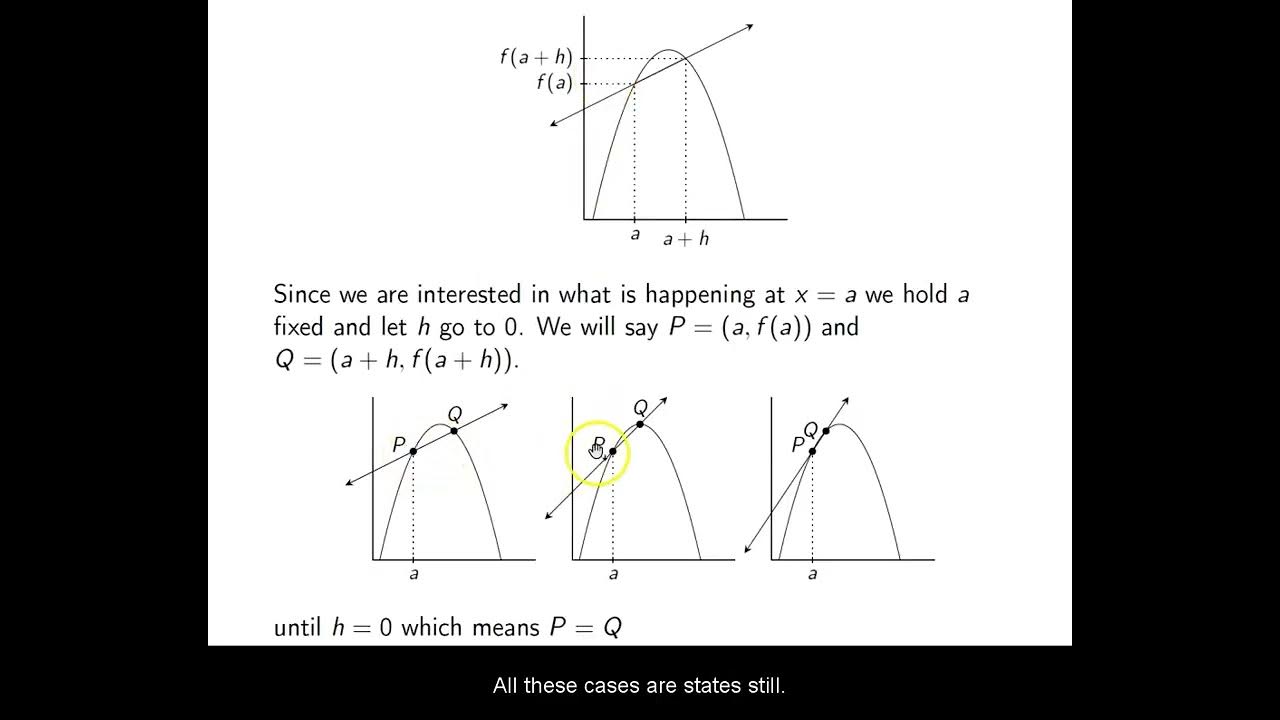
🔍 Instantaneous Velocity and the Limiting Process
This paragraph focuses on the concept of instantaneous velocity and how it can be determined from a graph. The lecturer explains that to find the instantaneous velocity at a specific time, one must look at the change in position over an infinitesimally small change in time (denoted as delta t). By examining the slope of the line connecting two points on the graph, one can approximate the velocity. As delta t approaches zero, this slope approaches the value of the derivative, which represents the instantaneous velocity. The paragraph also touches on the idea that a curved line can appear straight when viewed at a very small scale, which is key to understanding the relationship between the derivative and the slope of the tangent line to a curve.
🌐 The Derivative as the Slope of the Tangent Line
The fourth paragraph builds on the previous discussion by emphasizing the relationship between the derivative and the slope of the tangent line to a curve at any given point. The lecturer illustrates this by showing how the slope of the tangent line can be estimated by looking at the graph of a car's motion. It is explained that at points where the curve is steep, the velocity (and thus the slope of the tangent line) is higher, and where the curve is flat, the velocity is zero. The paragraph also introduces the concept that a circle, when viewed up close, appears to be a straight line, which is a practical example of how locally, a smooth curve can resemble a straight line.
🚀 Acceleration and the Second Derivative
In this paragraph, the lecturer introduces acceleration as the rate of change of velocity, which is the second derivative of the position function. The discussion continues with the analysis of the graph of a car's position over time, explaining how the second derivative can be interpreted as acceleration. The lecturer describes how the concavity of the curve (whether it is concave up or down) indicates whether the velocity is increasing or decreasing, which corresponds to positive or negative acceleration, respectively. The paragraph concludes with a visual demonstration of how the slope of the tangent line changes along the curve, reflecting the car's varying speed and acceleration.
📉 Derivative Graphs and the Mean Value Theorem
The lecturer discusses how the graph of a function's derivative can be sketched by measuring the slope of the tangent line at various points on the original curve. This process results in a new curve, which in the given example, is a cup-shaped parabola. Additionally, the paragraph introduces the Mean Value Theorem, which states that for any trip taken at an average velocity over a certain interval, there must have been at least one instant when the instantaneous velocity equaled the average velocity. This is demonstrated graphically by drawing a line representing the average velocity and finding where it intersects the original curve, indicating the point where the instantaneous velocity matches the average.
📘 L'Hôpital's Rule and Derivative Notations
The final paragraph provides a brief historical anecdote about L'Hôpital's Rule, a theorem in calculus that deals with the ratio of derivatives. It is mentioned that L'Hôpital did not prove the rule himself but took credit for it after a financial arrangement with a Bernoulli mathematician. The paragraph also touches on the different notations for derivatives used by Newton and Leibniz, with a focus on the common modern notation that involves a prime mark after a function to denote its derivative. The lecturer concludes the lecture by previewing the next topic, which will be the algebraic aspects of derivatives.
Mindmap
Keywords
💡Derivative
💡Integral
💡Fundamental Theorem of Calculus
💡Graph
💡Slope
💡Instantaneous Velocity
💡Tangent Line
💡Limit
💡Acceleration
💡Mean Value Theorem
Highlights
Introduction to the concept of the derivative and its relation to graphs.
The derivative as a measure of how quickly a change in time affects a change in position, such as instantaneous velocity.
Examples of how derivatives are used to understand changes in non-physical settings, like population growth or stock market fluctuations.
The importance of the steepness of a graph's curve in determining the rate of change, illustrated with the Chernobyl power plant incident.
Explanation of how to interpret a graph to understand the motion of a car on a straight road.
Differentiation between the car's forward and backward motion and the concept of velocity from the graph's direction.
The concept of slope as a measure of the steepness of a line, which corresponds to the car's speed.
The process of finding the instantaneous velocity of a car at a specific moment by using the concept of limits.
The idea that a smoothly curving line appears straight when viewed very closely, relating to the concept of derivatives.
Fundamental insights about the relationship between the slope of the tangent line and the derivative at a point on a curve.
How to determine the acceleration of a car by examining the second derivative, which is the derivative of the velocity function.
Graphical representation of the mean value theorem, showing that instantaneous velocity can equal average velocity over a trip.
Brief history of L'Hôpital's rule and its relation to derivatives, including the story of its origin and naming.
Different notations for derivatives used by Newton and Leibniz, and the common modern notation involving a prime mark.
The process of sketching the graph of a derivative by measuring the slope of the tangent line at various points on the original function's graph.
The derivative's role in understanding the concavity of a curve and its implications for acceleration.
Anticipation of the next lecture focusing on the algebraic manifestation of derivatives.
Transcripts
Browse More Related Video
Mean value theorem | Existence theorems | AP Calculus AB | Khan Academy
Calculus 1 Lecture 3.2: A BRIEF Discussion of Rolle's Theorem and Mean-Value Theorem.

Definition of the Derivative
The paradox of the derivative | Chapter 2, Essence of calculus
Ch. 13.3 Tangent Lines and Derivatives

Math 11 - Sections 1.3-1.4
5.0 / 5 (0 votes)
Thanks for rating: