What does P-Value mean in Regression?
TLDRThis tutorial offers a clear explanation of p-values in the context of hypothesis testing, particularly for regression problems. It begins by defining the null hypothesis, which assumes no relationship between variables, and then introduces the concept of p-values as evidence against this hypothesis. A practical example involving pizza delivery times illustrates how a p-value of 0.001 can lead to rejecting the null hypothesis in favor of an alternative one. The video then relates this back to regression analysis, explaining that low p-values (<0.05) suggest significant variables that contribute to the model, while higher p-values indicate variables with no significant effect. The presenter provides a step-by-step guide to interpreting p-values for five variables, helping viewers understand which variables are meaningful in their regression models.
Takeaways
- 🧐 The p-value is a statistical measure used in hypothesis testing to help determine whether to support or reject the null hypothesis.
- 🎯 The null hypothesis in regression states that there is no relationship between the dependent and independent variables, implying the coefficients are zero.
- 📊 A p-value is considered evidence against the null hypothesis; the smaller the p-value, the stronger the evidence to reject the null hypothesis.
- 🍕 An example given in the script is a pizza place claiming an average delivery time of 30 minutes or less, which can be tested with a hypothesis test.
- 🔢 A p-value of 0.001 indicates there's a 0.1% chance of mistakenly rejecting the claim, which is strong evidence to reject the null hypothesis, typically when p < 0.05.
- 🔑 In the context of regression, a p-value associated with each variable tests the null hypothesis that the coefficient of that variable is zero (no effect).
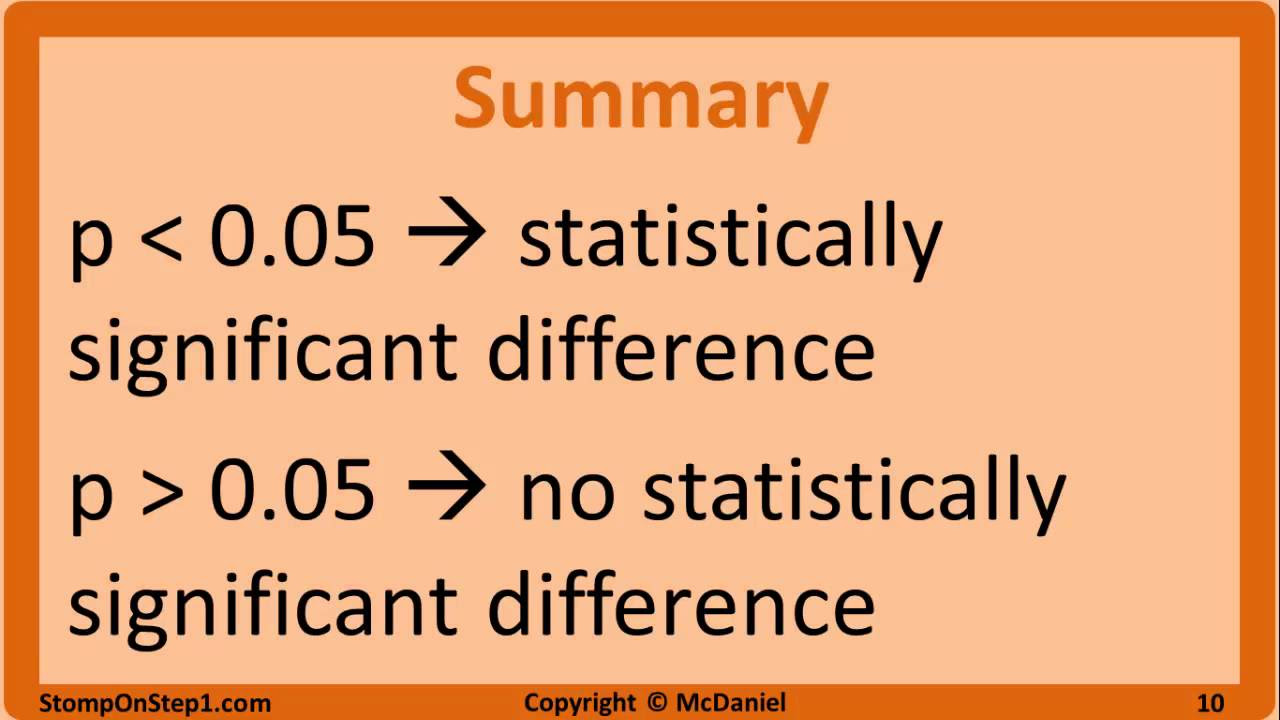
- 🚫 A low p-value (<0.05) suggests that the variable is likely a meaningful addition to the model, as it indicates a relationship between the predictor and the response variable.
- 🆗 A high p-value (>0.05) suggests that changes in the predictor are not significantly associated with changes in the response variable, and the null hypothesis is not rejected.
- 📈 The script discusses a regression problem with five variables, and the p-values help determine which variables significantly contribute to the model.
- 📚 The first three variables in the example have p-values less than 0.05, indicating that their coefficients are not zero and they contribute to the predictor variable.
- 👍 The video aims to clarify the concept of p-values and their application in hypothesis testing, particularly in the context of regression analysis.
Q & A
What is a p-value and how is it used in hypothesis testing?
-A p-value is a measure used in hypothesis testing to determine the strength of evidence against a null hypothesis. It represents the probability of observing the data, or something more extreme, assuming the null hypothesis is true. If the p-value is small (typically less than 0.05), it suggests strong evidence to reject the null hypothesis.
What is the null hypothesis in the context of regression analysis?
-In regression analysis, the null hypothesis states that there is no relationship between the dependent and independent variables, meaning the coefficients of the independent variables are zero. This implies that the independent variables do not have an effect on the dependent variable.
What does it mean if a p-value is less than 0.05 in the context of hypothesis testing?
-If a p-value is less than 0.05, it indicates that there is a less than 5% chance that the observed results occurred by random chance alone. This is often considered a threshold for rejecting the null hypothesis and accepting the alternative hypothesis.
Can you explain the example given in the script about the pizza delivery times?
-The example involves a pizza place claiming an average delivery time of 30 minutes or less. The null hypothesis is that the mean delivery time is 30 minutes. The alternative hypothesis is that it is greater. A p-value of 0.001 suggests strong evidence against the null hypothesis, indicating that the pizza place's claim is likely incorrect.
How does the p-value help in determining the significance of variables in a regression model?
-The p-value associated with each variable in a regression model tests the null hypothesis that the variable's coefficient is zero (no effect). A low p-value (typically less than 0.05) indicates that the variable is likely to be a meaningful addition to the model, as changes in its value are related to changes in the response variable.
What is the significance of a variable having a p-value greater than 0.05 in a regression model?
-A variable with a p-value greater than 0.05 suggests that there is not enough evidence to reject the null hypothesis that its coefficient is zero. This implies that the variable may not be significantly related to the response variable and could potentially be excluded from the model.
What does the script suggest about the variables 'age', 'time', and 'last contact age' in the regression problem?
-The script implies that the variables 'age', 'time', and 'last contact age' have p-values less than 0.05, indicating that they are significant predictors in the regression model and contribute to the final output variable.
How can the p-value be used to decide whether to include a variable in a regression model?
-If a variable's p-value is less than the significance level (commonly 0.05), it suggests that the variable has a significant effect on the dependent variable and should be included in the model. If the p-value is higher, the variable may not significantly contribute and could be excluded.
What is the relationship between the p-value and the strength of evidence against the null hypothesis?
-A smaller p-value indicates stronger evidence against the null hypothesis. It means that the observed data is less likely to occur if the null hypothesis were true, suggesting that the alternative hypothesis may be more plausible.
What is the significance of the 0.05 threshold in hypothesis testing?
-The 0.05 threshold, also known as the alpha level, is a conventional cutoff used in hypothesis testing to determine statistical significance. If the p-value is less than 0.05, it is generally considered that there is enough evidence to reject the null hypothesis.
How does the script suggest one should interpret the p-values of the variables in a regression analysis?
-The script suggests that variables with p-values less than 0.05 should be considered significant and likely contribute to the model, while those with higher p-values may not have a meaningful effect and could be disregarded.
Outlines
📊 Understanding P-values in Hypothesis Testing
The video script begins with an introduction to p-values and their role in hypothesis testing. It uses a regression problem as a context to explain the concept. The NULL hypothesis is defined as a statement that assumes no change or relationship exists between variables. The p-value is introduced as a measure of evidence against the NULL hypothesis, with a smaller p-value indicating stronger evidence to reject it. An example involving a pizza delivery time claim illustrates how p-values are used in practice. The video emphasizes that a p-value less than 0.05 typically leads to the rejection of the NULL hypothesis, while a value greater than 0.05 does not.
Mindmap
Keywords
💡p-value
💡hypothesis testing
💡null hypothesis
💡alternative hypothesis
💡regression problem
💡significant variables
💡coefficients
💡evidence against the null hypothesis
💡probability
💡reject the null hypothesis
Highlights
The tutorial provides a brief explanation on using p-values in hypothesis testing.
The speaker encountered confusion regarding p-values in a regression problem, prompting the creation of the video.
Null hypothesis is defined as the assumption that there is no relationship between variables.
P-value is used to support or reject the null hypothesis, with smaller values indicating stronger evidence against it.
A pizza delivery example is given to illustrate the concept of null hypothesis and p-value.
The significance of a p-value of 0.001 in rejecting the null hypothesis is explained.
A threshold of p-value less than 0.05 is commonly used to reject the null hypothesis.
The speaker discusses the significance of p-values in determining which variables are important in a regression model.
P-values test the null hypothesis that the coefficient of a variable is zero.
Variables with low p-values (<0.05) are considered to have a meaningful impact on the model.
High p-values suggest that changes in the predictor variable are not related to the response variable.
The first three variables in the example have p-values less than 0.05, indicating they are significant predictors.
The tutorial concludes with the speaker's hope that the video was informative and encourages viewers to subscribe.
Transcripts
Browse More Related Video

P Value and Hypothesis Testing Simplified|P-value and Hypothesis testing concepts in Statistics

What is a p-value?

05 - Using P-Values in Hypothesis Testing (Compare P Value to Level of Significance)

p-values: What they are and how to interpret them
Null Hypothesis, p-Value, Statistical Significance, Type 1 Error and Type 2 Error

What Is A P-Value? - Clearly Explained
5.0 / 5 (0 votes)
Thanks for rating: