Increasing, Decreasing, Positive, Negative Function Intervals
TLDRThe video script is an educational discourse on understanding the behavior of functions through their graphical representation. It emphasizes the importance of recognizing when a function is increasing or decreasing, as well as identifying whether it is positive or negative. The presenter uses the analogy of a roller coaster to illustrate the concept of a function's rise and fall. The discussion covers the mathematical notation for intervals, including the use of infinity and the distinction between using brackets and parentheses in different contexts. The script also addresses the practical applications of interpreting graphs, such as in economics, and stresses the relevance of these skills in real-world data analysis. The presenter provides a detailed explanation of how to interpret various sections of a function's graph, including the use of the union symbol to denote 'or' in mathematical terms. The summary aims to equip viewers with the ability to interpret complex data visually and understand the underlying trends.
Takeaways
- 📈 Understanding graph trends is crucial for interpreting data, such as economic graphs, which is a valuable life skill.
- ➡️ When analyzing a function's graph, we focus on whether it is increasing or decreasing, and whether it is positive or negative.
- ♾ The graph of a function extends to infinity in both directions along the x-axis, with arrows indicating this.
- 🔢 Positive infinity and negative infinity are theoretical points that the function approaches as it extends indefinitely.
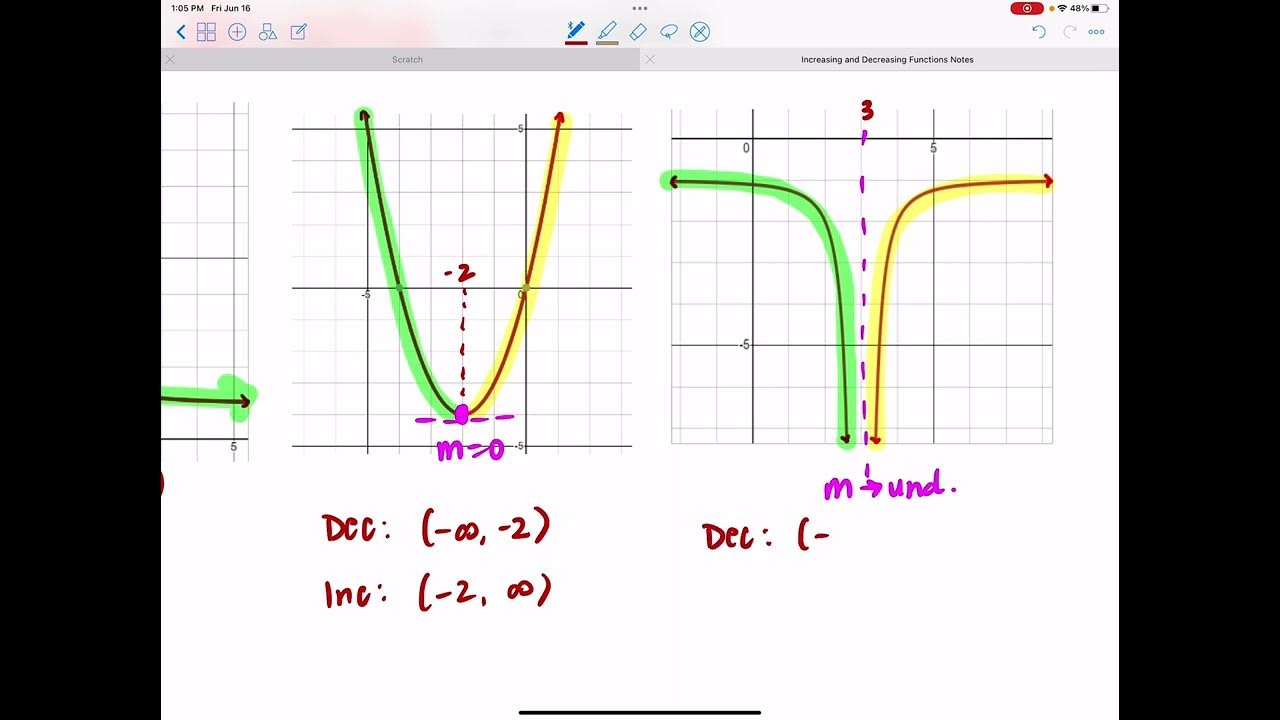
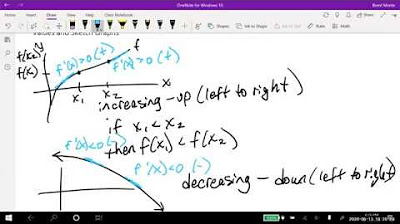
- 📌 The intervals where a function increases or decreases are determined by observing the direction of the graph's slope.
- 📉 A function is decreasing where it goes down and to the left or right, depending on the direction of the slope.
- 📈 A function is increasing where it goes up, which could be to the left or right as well.
- ➿ The union symbol is used to combine intervals where the function is positive or increasing, indicating an 'or' relationship.
- 💡 Online math platforms and the AP Calculus exam may have specific notations they accept, such as using parentheses or brackets to denote intervals.
- 🔑 It's important to recognize the difference between domain (where the function is defined) and the intervals of increase or decrease.
- ✅ Always use parentheses when denoting intervals to play it safe across different platforms and exams.
- 📋 Writing intervals in a way that includes the endpoint (using brackets) or excludes it (using parentheses) can depend on the context and the platform's requirements.
Q & A
What are the two main characteristics of a function's graph that are discussed in the transcript?
-The two main characteristics discussed are whether the function is increasing or decreasing, and whether the function is positive or negative.
What does the speaker suggest to do when encountering the term 'infinity' in the context of a function's graph?
-The speaker suggests to imagine the graph extending indefinitely in the positive or negative direction along the x-axis, and to feel free to reference a quote from Buzz Lightyear when mentioning 'going to infinity'.
How does the speaker describe the behavior of a function's graph as it approaches negative infinity?
-The speaker describes the graph as going down and to the left, indicating that it is decreasing and moving towards the left on the coordinate plane as it approaches negative infinity.
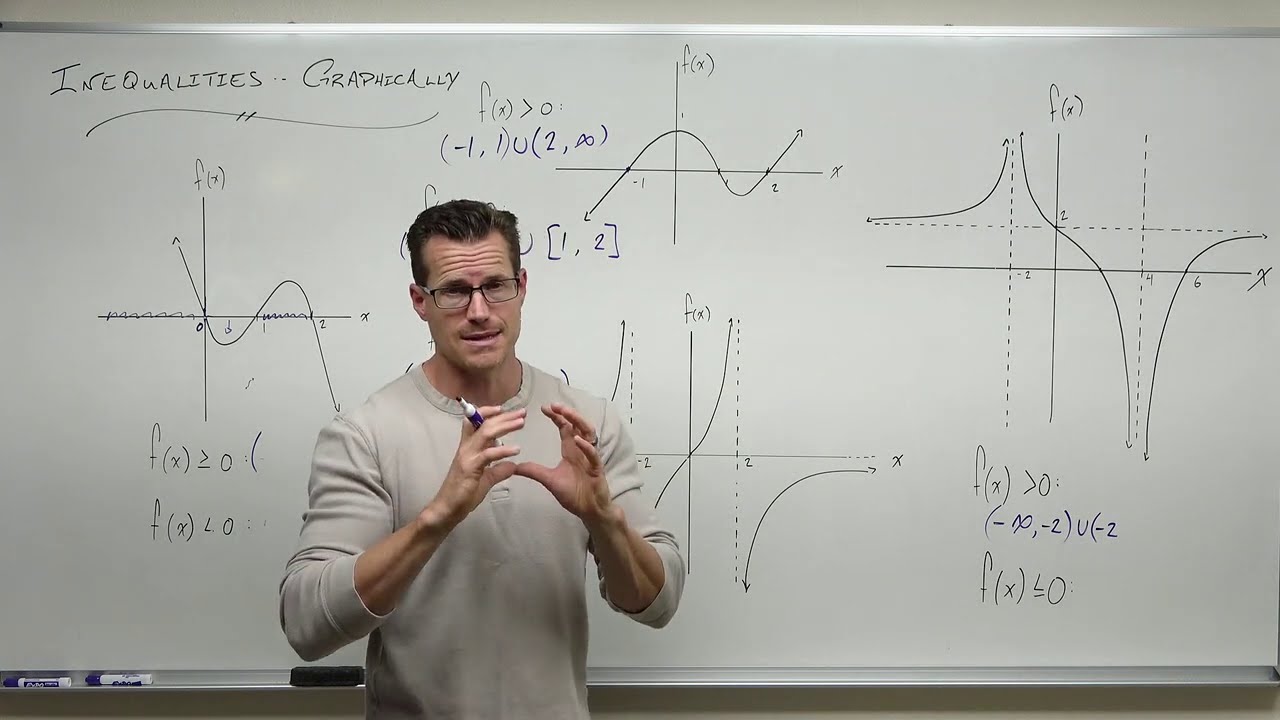
What is the interval notation for the section of the function where it is increasing, according to the transcript?
-The interval notation for the section where the function is increasing is from negative infinity to 1, which can also be written as all x values less than one.
How does the speaker address the issue of online math platforms and their acceptance of certain interval notations?
-The speaker acknowledges a glitch in some online math platforms, like Delta Math, where certain interval notations are not accepted. They suggest that both 'negative infinity to 1' and 'all x values less than one' are valid notations, but recommend using the latter for compatibility with such platforms.
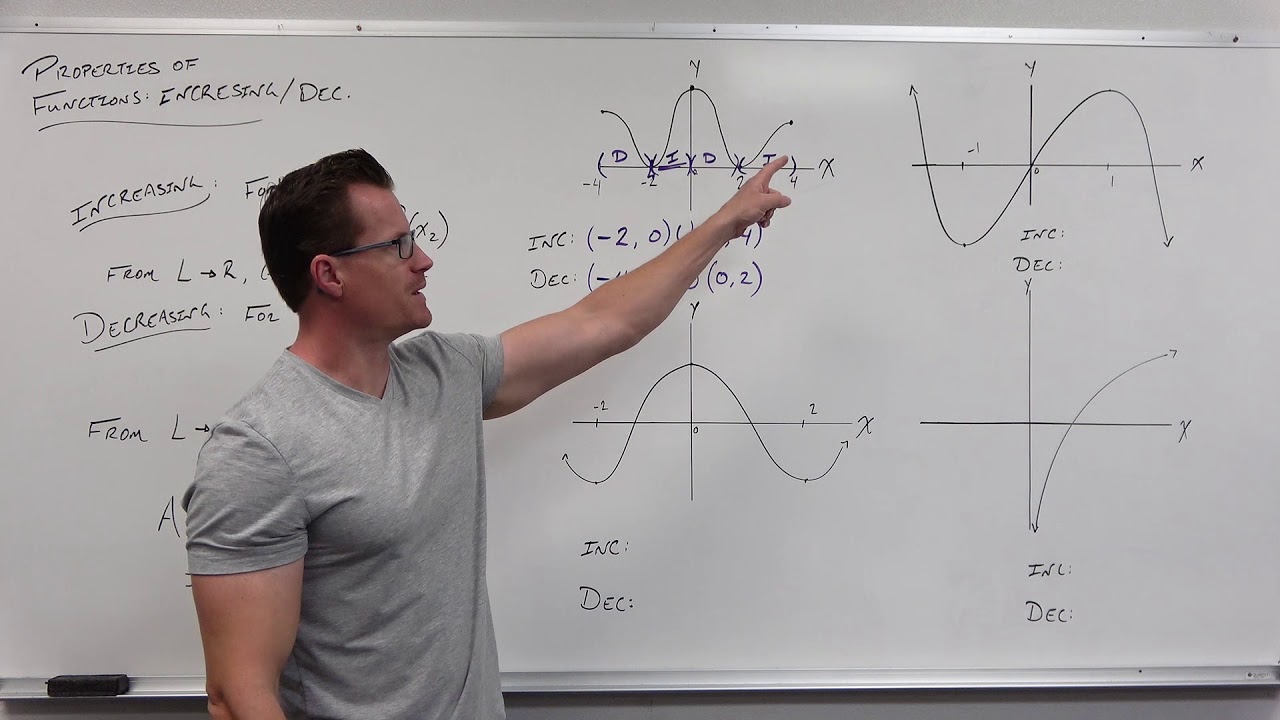
What is the interval during which the function is positive, as mentioned in the transcript?
-The function is positive during the interval from negative 2 to 4, which can also be written as all x values greater than negative 2 and less than 4.
What is the interval during which the function is negative, according to the transcript?
-The function is negative during two intervals: from negative infinity to negative 2, and from 4 to infinity, which can also be written as all x values less than negative 2 or greater than 4.
What does the union symbol represent when discussing intervals where the function is positive or negative?
-The union symbol represents the mathematical concept of 'or', indicating that the function is positive (or negative) in either of the separate intervals listed.
Why is it important to be able to interpret a function's graph in terms of its positive or negative values and increasing or decreasing behavior?
-Interpreting a function's graph is important because it helps in understanding trends and patterns, which is a practical skill needed in real-world applications, such as interpreting economic or scientific data.
What does the speaker mean by 'riding a roller coaster' when describing the graph of a function?
-The speaker uses the 'riding a roller coaster' analogy to describe the visual process of tracing the graph of a function with a pencil or finger, to determine its increasing and decreasing behavior.
How does the speaker differentiate between using brackets and parentheses when denoting intervals on a graph?
-The speaker suggests that brackets are used when the endpoint is included in the interval (closed interval), while parentheses are used when the endpoint is not included (open interval). However, they also note that some online platforms and tests may accept either, and it's a matter of personal preference or platform requirement.
Outlines
📈 Understanding Function Graphs and Their Behavior
This paragraph introduces the concept of analyzing function graphs to determine whether the function is increasing or decreasing and whether it is positive or negative. It emphasizes the importance of understanding the intervals involved and the behavior of the graph as it approaches infinity in both directions. The speaker uses the analogy of a roller coaster to describe the ups and downs of the function and discusses the technicalities of representing intervals on a graph, including the use of online math tools and the AP Calculus exam standards.
📉 Identifying Positive and Negative Intervals of a Function
The second paragraph delves into identifying where a function is positive or negative by observing whether it lies above or below the x-axis. The speaker outlines specific intervals where the function is negative, from negative infinity to negative 2 and from 4 onwards, and where it is positive, between negative 2 to 4. The use of the union symbol to combine intervals and the discussion of different ways to represent these intervals, such as using less than or greater than notations, are also covered. The paragraph highlights the importance of understanding these concepts for practical applications and the interpretation of data.
Analyzing Function Behavior with Parentheses and Brackets
The third paragraph discusses the use of parentheses and brackets when representing intervals on a graph, particularly when the function's value is exactly zero at certain points. The speaker provides personal opinions on the use of these symbols and how different platforms and tests may accept one notation over the other. The paragraph continues with an exploration of the function's behavior, identifying intervals where the function is decreasing, increasing, and both, as well as where it is negative and positive. The importance of understanding these concepts for real-world data interpretation is reiterated.
🎓 Practical Application: Interpreting Graphs in Real Life
In the final paragraph, the speaker emphasizes the practical application of understanding graph behavior, such as interpreting economic trends. The importance of being able to identify when a graph is showing an increase or decrease and when values are positive or negative is highlighted. The speaker encourages viewers to practice interpreting graphs and understanding the trends they represent, as this is a valuable life skill. The paragraph concludes with a summary of the key concepts discussed, including positive, negative, increasing, and decreasing behaviors of functions on a graph.
Mindmap
Keywords
💡Increasing
💡Decreasing
💡Positive
💡Negative
💡Infinity
💡Domain
💡Interval Notation
💡Graph Interpretation
💡X-axis
💡Coordinates
💡Union Symbol
Highlights
The speaker emphasizes the importance of understanding the intervals of a function's graph, particularly as it approaches infinity.
The concept of a function's graph going to infinity in both directions is introduced, with a humorous reference to Buzz Lightyear.
The speaker explains the visual representation of a function's increase and decrease by comparing it to a roller coaster ride.
The function's intervals of increase are identified as from negative infinity to 1, and the speaker discusses potential online math platform glitches.
Interval notation is discussed, with the speaker providing alternative ways to express the intervals, such as using 'less than' or 'all x values'.
The speaker identifies the intervals where the function is positive, from negative 2 to 4, and discusses the use of parentheses in online platforms.
The concept of the function being negative is explored, with intervals identified from negative infinity to negative 2 and from 4 to infinity.
The use of the union symbol in mathematics to represent 'or' is explained in the context of function intervals.
The speaker provides a technical explanation for why a parenthesis is used at a specific point on the graph, relating to the function's behavior.
The importance of interpreting graphs in real-world applications, such as understanding economic trends, is highlighted.
The speaker discusses the practicality of being able to read and interpret graphs, which is a valuable life skill beyond academic settings.
The concept of a function's intervals of increase and decrease is applied to a new graph, with the speaker identifying specific sections.
Interval notation is used to express the function's behavior, with the speaker providing clarity on the use of brackets and parentheses.
The speaker identifies where the function is positive and increasing, using the metaphor of a snake in the water to describe the graph's shape.
The speaker reiterates the importance of understanding when a function is positive, negative, increasing, or decreasing for data interpretation.
The speaker provides a comprehensive overview of the function's behavior on the graph, summarizing the key points for the audience.
Transcripts
Browse More Related Video
5.0 / 5 (0 votes)
Thanks for rating: