How to calculate One Tail and Two Tail Tests For Hypothesis Testing.
TLDRThis tutorial introduces the concepts of one-tailed and two-tailed tests in statistics. The video explains the normal distribution curve, where the population mean (μ) is located at the center. The sample mean (x̄) can vary and is represented by a shaded area on the curve. The one-tailed test is demonstrated with a 95% confidence level, implying a 5% chance that the sample mean will fall in the red 'rejection region' or 'alpha' area. In contrast, a two-tailed test at the same confidence level splits the 5% alpha into two equal parts, allocating 2.5% to each tail. The critical z-scores for a one-tailed test are ±1.645, while for a two-tailed test they are ±1.96. The video serves as an introductory guide to understanding these fundamental statistical tests, with more in-depth content to follow.
Takeaways
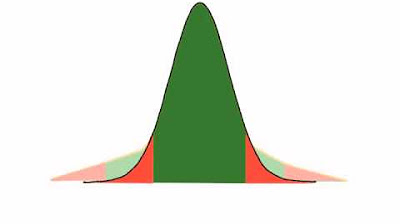
- 📊 The bell curve represents 100% of all possible events with the population mean (μ) at the center.
- 📈 A sample mean (x̄) can vary and is represented within the green area of the bell curve.
- 🔴 In a one-tail test at a 95% confidence level, there is a 5% chance the sample mean will fall in the red area, known as the rejection region or alpha.
- 🎯 The red area signifies a critical value or alpha, which is the probability of rejecting the null hypothesis when it is actually true.
- 📉 For a one-tail test to the right of the mean, there's a 95% chance the sample mean will be in the green area, with a 5% chance in the red area.
- 📌 In a two-tail test at 95% confidence, the red area is split equally to the left and right, each representing 2.5%.
- 🧮 Alpha divided by two (α/2) is used in two-tail tests to allocate the rejection region symmetrically around the mean.
- 🔢 The sum of the probabilities in a two-tail test equals 100%, covering all possible observations.
- 📉 In a two-tail test, the critical z-scores are -1.96 and +1.96, representing the boundaries of the rejection region.
- 📈 For a one-tail test, the critical z-score to the right is +1.645, and to the left is -1.645.
- 🔍 The tutorial provides an introduction to understanding one-tail and two-tail tests in statistical analysis.
Q & A
What does the bell curve represent in the context of the tutorial?
-The bell curve represents the normal distribution and symbolizes 100% of all possible events in a statistical analysis.
What is the population mean denoted by in the script?
-The population mean is denoted by the Greek letter 'mu' (μ), which looks like a 'u' but is pronounced as 'me'.
What is the notation used for the sample mean in the script?
-The notation used for the sample mean in the script is 'x̄' (x-bar).
What is the probability associated with the sample mean being in the green area in a one-tail test with a 95% confidence level?
-In a one-tail test with a 95% confidence level, there is a 95% chance that the sample mean will be in the green area, and a 5% chance it will be in the red area.
What is the term used to describe the red area in a one-tail test?
-The red area in a one-tail test is often referred to as 'Alpha', which is also the Greek letter α, and can be used as the P-value or the rejection region.
How is the red area distributed in a two-tail test at a 95% confidence level?
-In a two-tail test at a 95% confidence level, the red area is split evenly, with 2.5% on the left side and 2.5% on the right side of the population mean.
What does Alpha / 2 represent in a two-tail test?
-Alpha / 2 represents the division of the total alpha (5% in a 95% confidence level) into two equal parts for the two-tail test, resulting in 2.5% in each tail.
What are the critical values for a two-tail test at a 95% confidence level?
-The critical values for a two-tail test at a 95% confidence level are z-scores of -1.96 on the left and +1.96 on the right.
What are the critical values for a one-tail test at a 95% confidence level?
-The critical values for a one-tail test at a 95% confidence level are z-scores of +1.645 on the right and -1.645 on the left.
What does the term 'rejection region' refer to in the context of hypothesis testing?
-The 'rejection region' refers to the area under the curve where the null hypothesis would be rejected in favor of the alternative hypothesis, based on the predetermined significance level.
How does the sample mean's position relative to the population mean affect the outcome of a statistical test?
-If the sample mean falls within the rejection region, the null hypothesis is rejected. If it falls in the non-rejection region (green area in the script), the null hypothesis is not rejected.
What is the significance of the 95% confidence level in the context of the tutorial?
-The 95% confidence level indicates that if the experiment were repeated many times, the true population mean would fall within the calculated range 95% of the time.
Outlines
📊 Introduction to One-Tail and Two-Tail Tests
This paragraph introduces the concept of one-tail and two-tail tests in statistical analysis. It explains the use of a normal bell curve to represent all possible events, with the population mean (μ) at the center. The sample mean (x̄) can vary and is shown within a green area on the curve. A one-tail test is conducted with a 95% confidence level, which means there's a 5% chance (referred to as Alpha or P-value) that the sample mean will fall in the red area, also known as the rejection region. The critical value for a one-tail test at this confidence level is ±1.645. The paragraph also contrasts this with a two-tail test, where the red area is split equally to the left and right of the mean, resulting in a 2.5% chance in each tail and a 95% chance in the green area. The critical values for a two-tail test are ±1.96.
Mindmap
Keywords
💡Bell Curve
💡Population Mean (Mu)
💡Sample Mean (X-bar)
💡Probability
💡One-Tail Test
💡Two-Tail Test
💡Confidence Level
💡Alpha (α)
💡P-value
💡Rejection Region
💡Critical Values
💡Z-scores
Highlights
The tutorial discusses one tail and two tail tests, which are statistical tests used to determine if a sample mean is significantly different from a population mean.
A normal bell curve is used to represent 100% of all possible events, with the population mean in the middle denoted by the Greek letter mu.
The sample mean can be anywhere within the green area of the bell curve, either above or below the population mean.
In a one tail test, there is a specified probability (e.g. 95%) that the sample mean will be in the green area, and a 5% chance it will be in the red area known as the rejection region.
The red area, or Alpha, represents the probability of rejecting the null hypothesis when it is actually true.
In a two tail test, the red area is split equally between the left and right sides of the bell curve, each representing a 2.5% chance the sample mean will be in the respective tail.
The critical values for a 95% confidence level in a two tail test are -1.96 and +1.96 z-scores.
For a one tail test at the same confidence level, the critical values are -1.645 and +1.645.
The tutorial provides a clear introduction to the concepts and calculations involved in one and two tail tests.
Different confidence levels can be used in the tests, allowing for flexibility in the desired level of certainty.
The sample mean must fall within the green or red areas of the bell curve, as these cover 100% of all possible outcomes.
The Greek letter alpha (α) is used to represent the probability of the rejection region in both one and two tail tests.
The tutorial explains the concept of a null hypothesis and how it is tested using one and two tail tests.
The probability of the sample mean falling in the green area represents the likelihood of not rejecting the null hypothesis.
The tutorial uses visual aids like the bell curve to make the statistical concepts more accessible and easier to understand.
The difference between one tail and two tail tests is clearly explained, highlighting when each type of test is appropriate to use.
The tutorial provides a foundation for further learning about statistics and conducting hypothesis tests.
The critical values for different confidence levels and tail configurations are explained, aiding in the interpretation of test results.
Transcripts
Browse More Related Video

One Tailed and Two Tailed Tests, Critical Values, & Significance Level - Inferential Statistics

Elementary Statistics - Chapter 8 - Hypothesis Testing Part 3 Revised

P Values, z Scores, Alpha, Critical Values

One-tailed and two-tailed tests | Inferential statistics | Probability and Statistics | Khan Academy

Meaning of P-value and Alpha

How to calculate t distributions
5.0 / 5 (0 votes)
Thanks for rating: