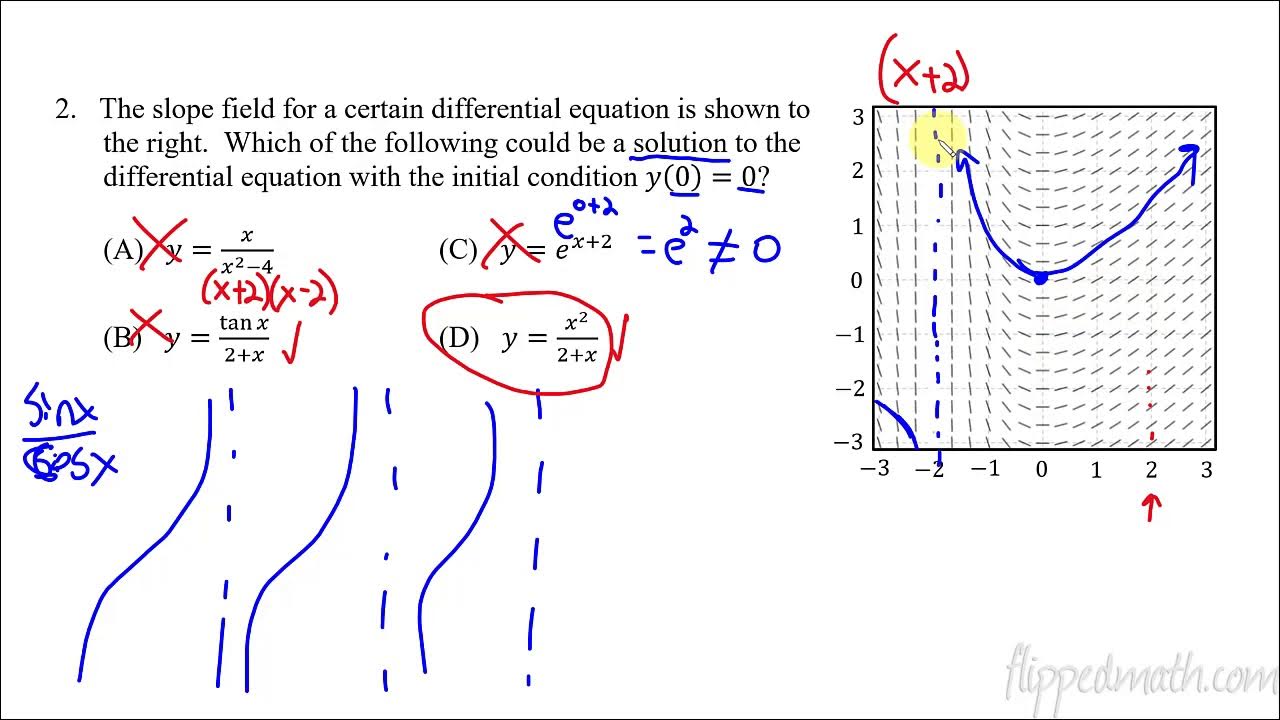
Calculus AB/BC – 5.8 Sketching Graphs of Functions and Their Derivatives
TLDRIn this calculus lesson, Mr. Bean guides students through the process of sketching graphs from derivatives and functions. He emphasizes that understanding the slope of a function, which is its derivative, is crucial for graphing. The video covers identifying key points such as maximums, minimums, and points of inflection directly from the derivative graph. Mr. Bean also highlights the importance of recognizing patterns, such as the derivative of a parabola being a straight line, to save time. Additionally, he demonstrates how to use a calculator to graph the derivative of a function, showcasing the utility of technology in visualizing mathematical concepts. The lesson concludes with a reminder that while practice problems are challenging, they are essential for mastering the subject.
Takeaways
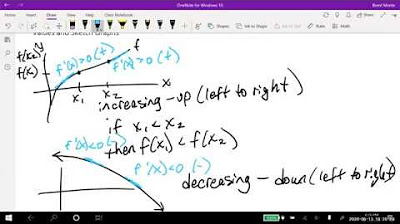
- 📈 The slope of a function f(x) is given by its derivative f'(x), which is crucial for graphing and understanding the behavior of the function.
- 🔍 Recognizing the slope at various points on the graph of f(x) helps predict the shape of f'(x), the derivative graph.
- ➿ At points where the slope is zero, the function has either a maximum or a minimum, which are key features to identify on the graph.
- 🔽 A negative slope indicates a downward shift, while a positive slope indicates an upward shift on the graph of the derivative.
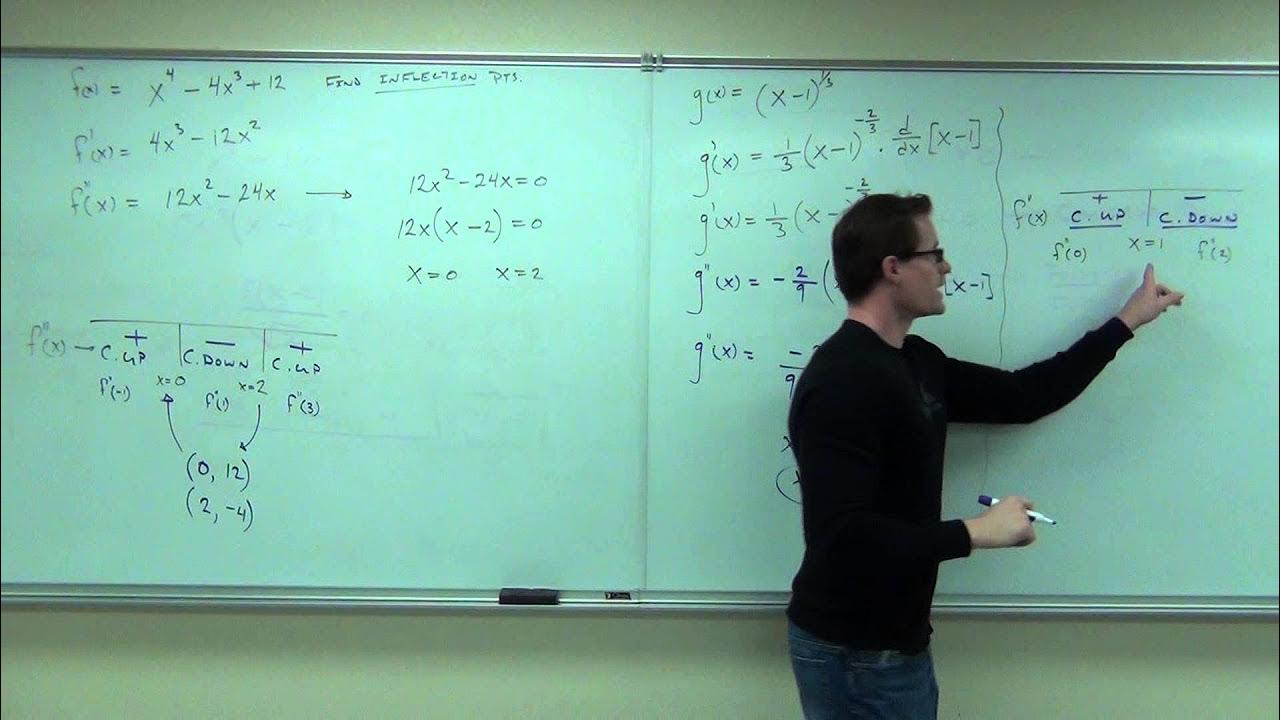
- ↗️ Points of inflection, where the concavity of the graph changes, are also zeros of f''(x), the second derivative.
- 🔄 When sketching f(x) from f'(x), there could be an infinite number of possible graphs due to potential vertical shifts (plus a constant, c).
- 📊 The x-values of the maximums, minimums, and points of inflection should match when sketching the original function from its derivative.
- 🔑 Recognizing patterns in derivatives, such as the linear derivative of a parabolic function x^2, can provide shortcuts in graphing.
- 🚫 Be cautious not to rely solely on shortcuts, as complex functions may not follow simple derivative patterns.
- 📐 Calculators can graph the derivative of a function without manually finding the derivative, which can be a useful tool for visualizing the function's behavior.
- 📋 Practice is essential for mastering the skill of graphing functions and their derivatives, especially for high-stakes exams like AP Calculus.
- ✅ Always check your work and answers to ensure accuracy and reinforce understanding of calculus concepts.
Q & A
What is the main topic of the calculus lesson?
-The main topic of the lesson is how to sketch graphs from derivatives and functions, understanding how they interrelate.
Why is it important to understand the slope of a function in calculus?
-The slope of a function (f) is represented by its derivative (f'). Understanding the slope is crucial as it helps in identifying key features of the graph such as maximum and minimum points, points of inflection, and the overall behavior of the function.
What is the significance of a zero slope in the context of a function's graph?
-A zero slope indicates a point on the graph where the function changes direction, which corresponds to either a maximum or a minimum point.
How does the sign of the derivative (f') relate to the concavity of the function's graph?
-The sign of the derivative determines the concavity of the graph. A positive derivative indicates the graph is concave up, while a negative derivative indicates the graph is concave down.
What is the role of the second derivative (f'') in sketching a graph?
-The second derivative helps to identify points of inflection on the graph, where the concavity of the function changes.
Why is it necessary to be cautious when sketching a graph based on the derivative alone?
-The original function (f) could be shifted vertically from the derivative (f') due to a constant (c). Therefore, without knowing the constant, there could be an infinite number of possible graphs that fit the derivative.
What are the key features of a graph that should match up when sketching from the derivative?
-The key features that should match up include the x-values of the minimums, maximums, and points of inflection.
What is a shortcut method to sketch the derivative graph of a parabola?
-If you recognize the original function as a parabola (like y = x^2), you can use the fact that its derivative (2x) will be a straight line, and the graph of that straight line will be a constant (y = 2).
How can a graphing calculator help in sketching the derivative of a function?
-A graphing calculator can directly compute and graph the derivative of a function without manually finding the derivative. This can save time and provide a visual representation of the derivative.
What is the importance of understanding the relationship between the derivative and the original function when graphing?
-Understanding the relationship allows you to identify critical points on the graph, such as maxima, minima, and points of inflection, which are essential for accurately sketching the graph of the original function.
What is the purpose of the practice problems in the lesson?
-The practice problems are designed to reinforce the understanding of sketching graphs from derivatives and functions, as this skill is frequently tested in AP exams.
Outlines
📈 Understanding Derivatives and Graph Sketching
This paragraph introduces the topic of sketching graphs from derivatives and functions. Mr. Bean emphasizes that while the lesson is short, the concept is not necessarily easy to grasp. He focuses on the slope of function f, which is its derivative, and uses this to identify key points such as maximum and minimum points, points of inflection, and areas of positive or negative slope on the graph. He also discusses how to sketch the derivative graph based on the original function's slope.
🔄 Derivative Sign Changes and Vertical Shifts
In this paragraph, Mr. Bean explains the implications of the derivative's sign changes on the original function's graph, identifying minimums and maximums. He cautions that when sketching the original function from its derivative, there could be a vertical shift due to an unknown constant, meaning there could be infinite possible graphs. He stresses the importance of correctly identifying key points such as minimums, maximums, and points of inflection, which should align with the x-values regardless of the shift.
🔢 Using a Calculator to Graph Derivatives
The final paragraph demonstrates how to use a calculator to graph the derivative of a function, using the function f(x) = sine(e^x) as an example. Mr. Bean shows that instead of manually finding the derivative, one can use the calculator's derivative function to graph it directly. He walks through the process on a TI-84 calculator, highlighting how the calculator can display the derivative's graph alongside the original function, which can help in identifying maximum and minimum points without the need for manual calculations.
Mindmap
Keywords
💡Derivative
💡Graph Sketching
💡Slope
💡Maximum and Minimum Points
💡Point of Inflection
💡Practice Problems
💡AP Exam
💡Constant Shift
💡Concavity
💡Chain Rule
💡Calculator
Highlights
Mr. Bean introduces a calculus lesson focusing on sketching graphs from derivatives and functions.
The lesson emphasizes the importance of understanding the slope of a function, which is represented by the derivative.
The slope of a function at a maximum or minimum point is zero, a key concept for graphing.
Positive and negative slopes are associated with different sections of the graph, indicating steepness and direction.
The concept of inflection points, where the concavity of a graph changes, is discussed.
The derivative graph can be sketched based on the original function's slope characteristics.
A parabola's derivative graph is linear, providing a shortcut for graphing.
The derivative graph can indicate minimum and maximum points, as well as points of inflection.
When sketching the original function from its derivative, there could be a vertical shift due to an unknown constant.
The importance of matching the x-values of minimums, maximums, and points of inflection when sketching the original function is stressed.
The use of calculators to graph derivatives without manually finding them is demonstrated.
The video shows how to use a TI-84 calculator to graph the derivative of a function.
The derivative graph can help identify features of the original function, such as maxima and minima, without explicit calculation.
The lesson includes practice problems to reinforce understanding of graphing derivatives.
The significance of recognizing patterns in derivatives for efficient graphing is highlighted.
The video concludes with a reminder to check answers and encourages mastery of the material for AP exam readiness.
Transcripts
Browse More Related Video

Calculus AB/BC – 5.6 Determining Concavity of Functions over Their Domains

Calculus AB/BC – 7.4 Reasoning Using Slope Fields

Math 11 - Section 3.1

Calculus 1 Lecture 3.4: The Second Derivative Test for Concavity of Functions

Calculus Review Maximum and Minimum Values of Functions

Calculus AB/BC – 4.3 Rates of Change in Applied Contexts Other Than Motion
5.0 / 5 (0 votes)
Thanks for rating: