Graphing Transformations with Tangent and Cotangent (Precalculus - Trigonometry 14)
TLDRThis video script offers a comprehensive guide on transforming the graphs of tangent and cotangent functions. The presenter explains how to apply vertical shifts, stretches or compressions, and period alterations to these trigonometric functions. The discussion emphasizes the importance of understanding the period of tangent and cotangent, which is π, differing from the 2π period of sine and cosine. The script outlines a step-by-step process for graphing these functions, starting with identifying vertical shifts, adjusting the period based on the coefficient of x, and then plotting key features such as vertical asymptotes and x-intercepts. The presenter also highlights the symmetry of the tangent function's period around the y-axis and the cotangent's starting point at zero. The key points for both functions are determined by the quarters of their periods, with tangent naturally climbing and cotangent falling. The script concludes with an encouragement to apply this method consistently, as it builds upon fundamental algebraic principles and provides a clear framework for graphing these complex functions.
Takeaways
- 📈 Understanding transformations of tangent and cotangent graphs involves vertical shifts, stretches or compressions, and alterations to the period.
- ⏱️ The period of tangent and cotangent functions is π, not 2π, which is a key difference from sine and cosine functions.
- 🔄 For tangent, the period is centered around zero, while cotangent starts at zero and behaves similarly to sine and cosine in terms of its period placement.
- 📍 Vertical shifts in the function are indicated by any value added after the function name (e.g., 'a' in 'y = a * tan(x)') and affect the graph's position on the y-axis.
- 🔗 The coefficient of 'x' in the function determines the period's length and whether the graph will be horizontally stretched or compressed.
- 🔢 Key points of the graph, such as asymptotes and x-intercepts, are determined by the quarters of the period and any transformations applied to the function.
- 🔼 A vertical stretch or compression is achieved by multiplying the function's output by a factor, which can also reflect the graph across the x-axis if the factor is negative.
- 🔄 The process for graphing tangent and cotangent involves identifying vertical shifts, determining the period, finding the center and quarters of the period, and adjusting key points accordingly.
- 🤔 Grasping the concept of treating the shifted axis as a new reference point for key points helps in visualizing and drawing the graph accurately.
- 📐 For cotangent, the key points at the first and third quarters are positive one and negative one, respectively, which is the reverse of tangent's key points.
- ➕ When extending the graph for additional periods, add the period length to the end points and find new quarters for the next cycle of the graph.
Q & A
What are the key transformations discussed in the video for tangent and cotangent graphs?
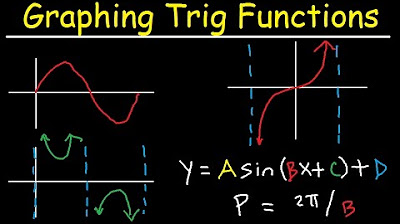
-The key transformations discussed in the video include vertical shift, vertical stretch or compression, and alteration of the period which is a horizontal stretch or compression.
How does a vertical shift affect the graph of a tangent or cotangent function?
-A vertical shift affects the graph by moving it up or down. If a positive value is added after the function (like 'b' in 'tan(b*x)'), the graph shifts up by that value, and if a negative value is added, it shifts down.
What is the period of a standard tangent function?
-The period of a standard tangent function is π (pi).
How does the coefficient of 'x' in a tangent function affect its period?
-The coefficient of 'x' in a tangent function affects its period by dividing π by that coefficient, resulting in a horizontal stretch or compression of the graph.
What are the key points of a tangent function that occur at the quarters of its period?
-For a tangent function, the key points at the quarters of its period are typically at the first quarter with a value of -1 and at the third quarter with a value of +1.
What is the main difference between the periods of tangent and cotangent functions?
-The main difference is that while both tangent and cotangent have a period of π, the tangent function's period is centered around zero, whereas the cotangent function starts at zero and goes to π, then from π to 2π.
How does a vertical stretch or compression affect the graph of a tangent or cotangent function?
-A vertical stretch or compression affects the graph by making it appear more horizontally narrow (stretch) or wider (compression). This is achieved by multiplying the output of the function by a certain factor (the coefficient 'a').
What is the significance of the first and third quarters of the period in graphing tangent and cotangent functions?
-The first and third quarters of the period are significant because they help determine the key points of the graph. These points are where the function values are at their maximum and minimum within each period, which is crucial for sketching the graph accurately.
How does the video script guide the process of graphing the function y = 3tan(x)?
-The script guides through identifying no vertical shift, determining the period as π (since it's tangent and there's no coefficient to divide by), placing the vertical asymptotes at the ends of the period (±π/2), finding the x-intercept at the origin, and then determining the key points at the quarters of the period (-1 at the first quarter and +1 at the third quarter). The coefficient '3' then stretches these key points vertically.
What is the effect of multiplying the function by a negative number, as in y = -2tan(3x) + 1?
-Multiplying the function by a negative number reflects the graph across the x-axis. In the case of y = -2tan(3x) + 1, the negative sign causes a reflection and the '2' causes a horizontal compression of the graph, while the '1' shifts the graph up by one unit.
How does the script differentiate between the graphing techniques for tangent and cotangent functions?
-The script differentiates by emphasizing that tangent functions are centered around zero and have a period that is symmetric about the y-axis, while cotangent functions start at zero and increase to π, then from π to 2π, having a different set of key points (+1 at the first quarter and -1 at the third quarter) and not being centered around zero.
Outlines
📈 Introduction to Graph Transformations of Tangent and Cotangent
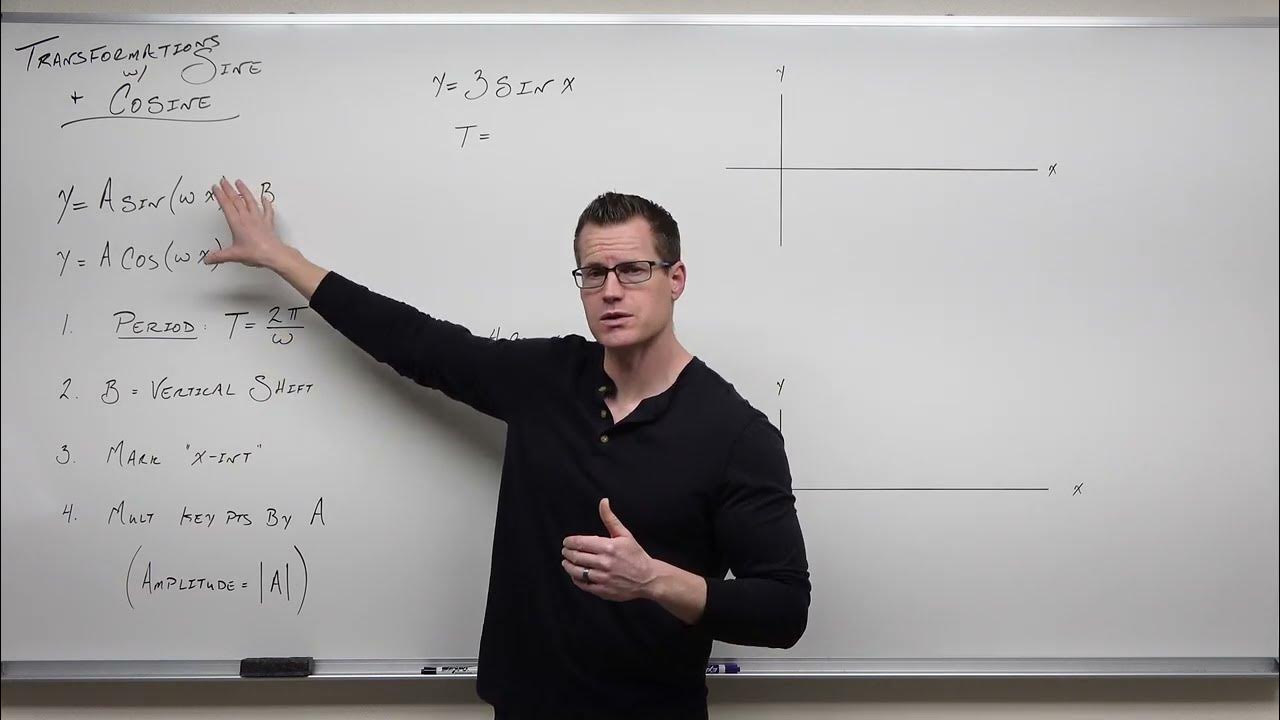
The video begins by introducing the topic of graph transformations, specifically focusing on the tangent and cotangent functions. It discusses how these functions can be transformed through vertical shifts, vertical stretches or compressions, and alterations to their period, which involves horizontal stretches or compressions. The approach to these transformations is compared to that of the sine and cosine functions, emphasizing the importance of understanding the causes of vertical shifts and how to adjust the period on the graph.
🔍 Key Features of Tangent and Cotangent Graphs
The paragraph delves into the specifics of the tangent and cotangent functions, highlighting that any term added after the function name results in a vertical shift. It also emphasizes the unique period of pi for both functions, contrasting it with the period of 2 pi for sine and cosine. The importance of the period's placement on the graph is discussed, with tangent's period being symmetric about the y-axis and cotangent's starting at zero and extending to pi and then 2 pi. The reciprocal nature of cotangent and its relationship to sine and cosine is also touched upon.
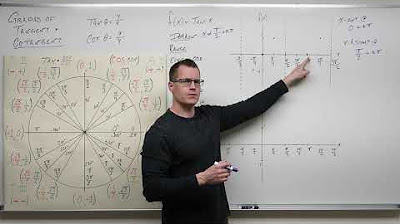
📐 Understanding the Period and Key Points of Tangent Graphs
This section explains how to determine the period of the tangent function, which is centered around zero and spans pi over 2 to the right and left. It outlines the process of identifying key points at the quarters of the period, which are crucial for graphing. The concept of vertical asymptotes at the ends of the period and x-intercepts at the center is introduced. The paragraph also describes how the tangent function naturally climbs, leading to key points of negative one at the first quarter and positive one at the third quarter.
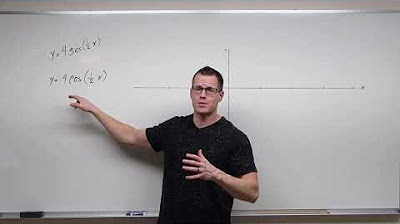
🤔 Applying Coefficients to Tangent and Cotangent Functions
The paragraph discusses the impact of the coefficient of the function on the key points of the graph. It explains that the coefficient multiplies the output of the function, leading to a vertical stretch or compression. The process of adjusting the graph based on the coefficient is demonstrated, with an example of multiplying by three to stretch the graph vertically. The concept of reflecting the graph if the coefficient is negative is also mentioned.
🎛️ Graphing Tangent Functions with Vertical Shifts
The focus shifts to graphing tangent functions that include vertical shifts. The paragraph explains how to identify vertical shifts and how they affect the placement of the graph's period. It details the process of adjusting the period based on the coefficient of x and how to find the quarters of the period. The importance of understanding the function's key features, such as vertical asymptotes and x-intercepts, is emphasized. The paragraph concludes with a step-by-step guide on how to graph a tangent function with a given set of transformations.
🔄 Graphing Cotangent Functions and Their Transformations
This section introduces the graphing of cotangent functions, noting the differences in the period's center and the direction of the graph's climb compared to tangent. It explains that cotangent starts at zero and has a period that is adjusted based on the coefficient of x, which in the given example results in a horizontal stretch. The process of identifying key points based on the quarters of the period and how they are affected by the function's coefficient is detailed. The paragraph concludes with a summary of the steps to graph a cotangent function with its respective transformations.
🔁 Repeating the Process for Multiple Periods of Cotangent
The paragraph explains how to extend the graph of a cotangent function for multiple periods. It describes the process of adding the period to the function to find additional centers and quarters, which allows for the graph to be repeated in a consistent manner. The importance of using a calculator for fraction calculations and understanding the relationship between the quarters and the key points is emphasized. The paragraph concludes with a reminder of the process for graphing cotangent functions, focusing on the necessity of identifying the function, its period, and key features.
📚 Summary of Graphing Techniques for Tangent and Cotangent
The final paragraph summarizes the technique for graphing tangent and cotangent functions, emphasizing the process of identifying the function, its period, and key features. It reiterates the importance of understanding the period's center and quarters for both functions and how to adjust these based on any transformations applied to the function. The paragraph concludes with a note on the next topic, which will be the graphs of secant and cosecant, and a positive message encouraging understanding and application of the taught technique.
Mindmap
Keywords
💡Vertical Shift
💡Period
💡Horizontal Stretch/Compression
💡Vertical Asymptotes
💡X-Intercept
💡Key Points
💡Coefficient of X
💡Phase Shift
💡Reciprocal Function
💡Symmetry
💡Graph Transformation
Highlights
The video discusses the transformation of tangent and cotangent graphs through vertical shifts, stretches, and period alterations.
Vertical shifts in tangent and cotangent functions cause the graph to move up or down, with '+' indicating up and '-' indicating down.
The period of tangent and cotangent is π, differing from the 2π period of sine and cosine.
The tangent function's period is centered on zero, while cotangent starts at zero and goes to π then to 2π.
Key points for tangent are at the first and third quarters of its period, with values of -1 and 1, respectively.
For cotangent, key points at the first and third quarters are 1 and -1, respectively, due to its decreasing nature.
The amplitude of a function affects its key points, causing a vertical stretch or compression.
The process of graphing tangent and cotangent involves identifying vertical shifts, determining the period, and finding key points based on quarters of the period.
An example is given for the function 3 tangent of x, illustrating the steps to graph it, including identifying the period as π/2.
The concept of horizontal stretch and compression is introduced, affecting the width of the graph's period.
The video demonstrates how to graph the function y = -2 tangent(3x + 1), including its vertical shift up by one unit.
Key points are manipulated based on the function's coefficient, resulting in new key points for the graph.
The process is reiterated with an emphasis on the importance of understanding the period and its impact on the graph's shape.
An additional cycle of the graph can be drawn by adding the period to the end of the current cycle.
The video concludes with a summary of the steps for graphing tangent and cotangent functions, emphasizing the technique's effectiveness.
The next video will cover the graphs of secant and cosecant, continuing the exploration of trigonometric function transformations.
Transcripts
Browse More Related Video
Graphing Transformations with Sine and Cosine (Precalculus - Trigonometry 12)
How to Graph Tangent and Cotangent (Precalculus - Trigonometry 13)
Graphing Trigonometric Functions, Phase Shift, Period, Transformations, Tangent, Cosecant, Cosine
How to Graph Cosecant and Secant (Precalculus - Trigonometry 15)
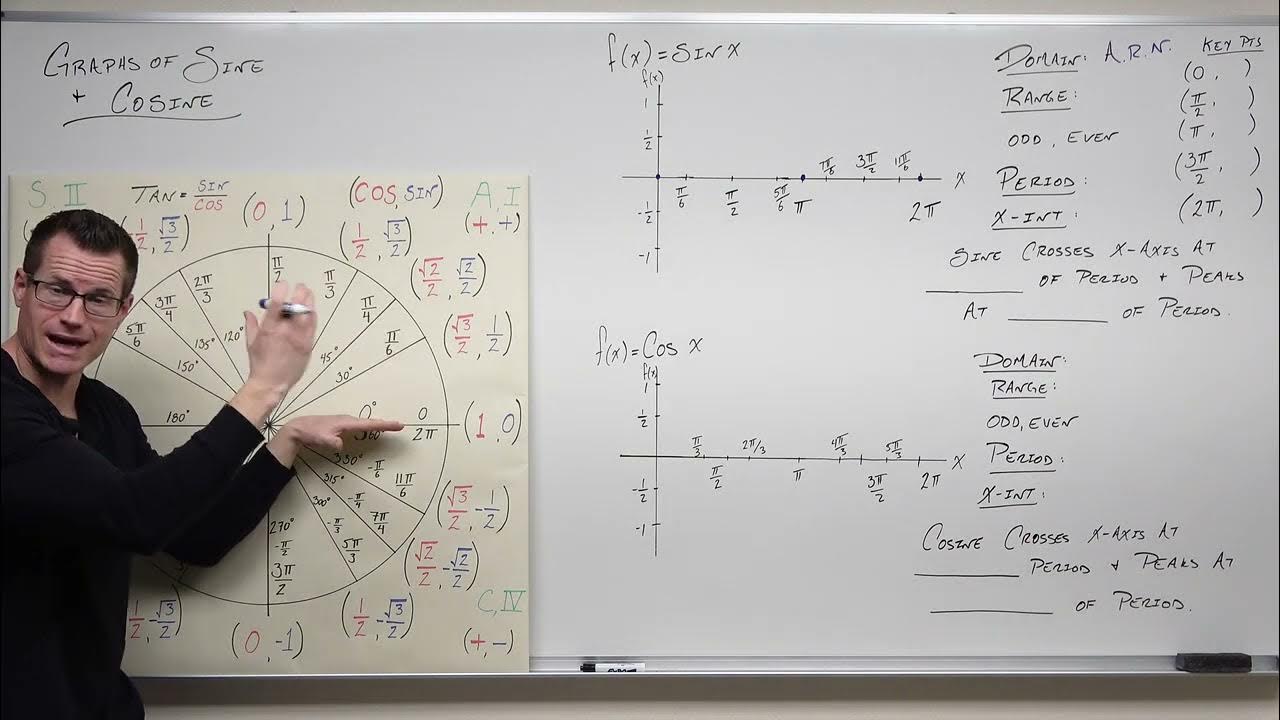
The Graphs of Sine and Cosine (Precalculus - Trigonometry 11)
Graphing Sine, Cosine, Cosecant, Secant, Tangent & Cotangent (Complete Guide)
5.0 / 5 (0 votes)
Thanks for rating: