Domain and Range of a Function From a Graph
TLDRThis video script offers a comprehensive introduction to the concepts of domain and range in the context of function graphs. It explains how to determine the set of x-values (domain) and y-values (range) for a function by analyzing the graph's key points and using interval notation. The script walks through multiple examples, demonstrating how to handle various scenarios, including continuous graphs, open and closed circles, and piecewise functions. The goal is to enhance the viewer's understanding and ability to apply these concepts to solve problems involving function graphs.
Takeaways
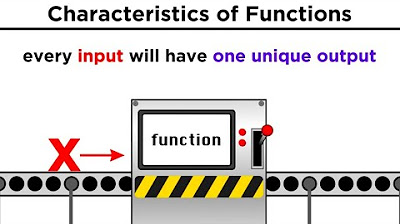
- 📌 The domain of a function refers to the set of all possible x-values, while the range refers to the set of all possible y-values.
- 📈 To determine the domain and range from a graph, identify the lowest and highest x and y values, including any intervals in between.
- 🔢 Interval notation is used to express the domain and range, with brackets indicating inclusion and parentheses indicating exclusion of endpoints.
- 🔄 When the graph is continuous without breaks, the range is the lowest to the highest y-value, inclusive of any closed circles.
- ⤴️ For graphs that extend infinitely in one direction, use an arrow to represent that the domain or range continues indefinitely.
- 🔽 A downward parabola has a domain of negative infinity to positive infinity, and the range is from negative infinity to a finite y-value, including the highest closed circle.
- 🔼 For piecewise functions or graphs with 'jumps', the domain and range must be described using the union symbol to connect the separate intervals.
- 📊 The range of a piecewise function can be found by considering each segment separately and then combining them using the union of their intervals.
- 🚫 If a graph has an open circle at a certain x-value, that value is not included in the domain.
- 🔄 For functions with multiple parts, identify the domain and range for each part separately and then combine them using the union symbol.
- 📈📉 Understanding the domain and range of functions, especially those with piecewise definitions, is crucial for analyzing and graphing mathematical functions.
Q & A
What is the domain of a function?
-The domain of a function refers to the set of all possible input values (x-values) for which the function is defined. It essentially tells us the range of values that we can plug into the function to get valid output.
How is the domain represented in interval notation?
-In interval notation, the domain is represented using brackets and parentheses to indicate whether the endpoints are included or excluded. For example, if the domain includes the lowest x value of -4 and the highest x value of 3, it would be written as [-4, 3], using brackets to denote that both endpoints are included.
What does the range of a function indicate?
-The range of a function indicates the set of possible output values (y-values) that result from the input values in the domain. It describes the possible results we can expect from the function based on the inputs provided.
How do you determine the range of a function from its graph?
-To determine the range from a function's graph, you look at the y-values and identify the lowest and highest points on the graph. If the graph is continuous and includes every y-value between these points, the range would be represented from the lowest to the highest y-value using interval notation.
What is the significance of the open circle and closed circle on a function graph?
-An open circle on a function graph indicates that the corresponding x-value is not included in the domain, meaning the function is not defined at that point. Conversely, a closed circle indicates that the x-value is included in the domain and the function is defined at that point.
How do you handle breaks in the graph when determining the domain and range?
-When there are breaks in the graph, the domain and range should be expressed as separate intervals that cover all the connected parts of the graph. You use the union symbol to combine the intervals when presenting the range for the entire function.
What is the domain of the function with an arrow going to infinity on the x-axis?
-If the graph of a function has an arrow going to infinity on the x-axis, it indicates that the domain extends to positive infinity on the right and negative infinity on the left. The domain would be represented as (-∞, ∞) using interval notation.
How do you express a function's domain that excludes a specific x-value?
-If a function's domain excludes a specific x-value, you would use parentheses to indicate that the value is not included. For example, if the domain excludes x = 1 but includes all other values from -6 to 5, it would be written as (-6, 5) with an open circle at 1.
What is the range of a parabola that extends infinitely downwards?
-For a parabola that extends infinitely downwards, the range will start at negative infinity since it keeps going down without end. However, if there is a highest y-value that the parabola does not exceed, such as 3, the range would be represented as (-∞, 3], including the highest y-value.
How do you represent a piecewise function's domain and range in interval notation?
-For a piecewise function, you would list the domain and range for each piece separately, using parentheses and brackets as appropriate. Then, you would use the union symbol to combine the intervals for the domain and range where they overlap or connect.
What is the union symbol in interval notation?
-The union symbol (⋃) in interval notation is used to combine two or more intervals into a single interval that represents the union of all the individual sets. It is used when a function's domain or range consists of separate, non-overlapping intervals.
How can you practice identifying domain and range using the concepts from the video script?
-To practice identifying domain and range, work through several examples by plotting the function graphs on a coordinate plane, noting the open and closed circles, and using interval notation to express both the domain and range. Start with simpler functions and gradually move on to more complex ones, including piecewise functions and those with breaks or asymptotes.
Outlines
📚 Introduction to Domain and Range with Interval Notation
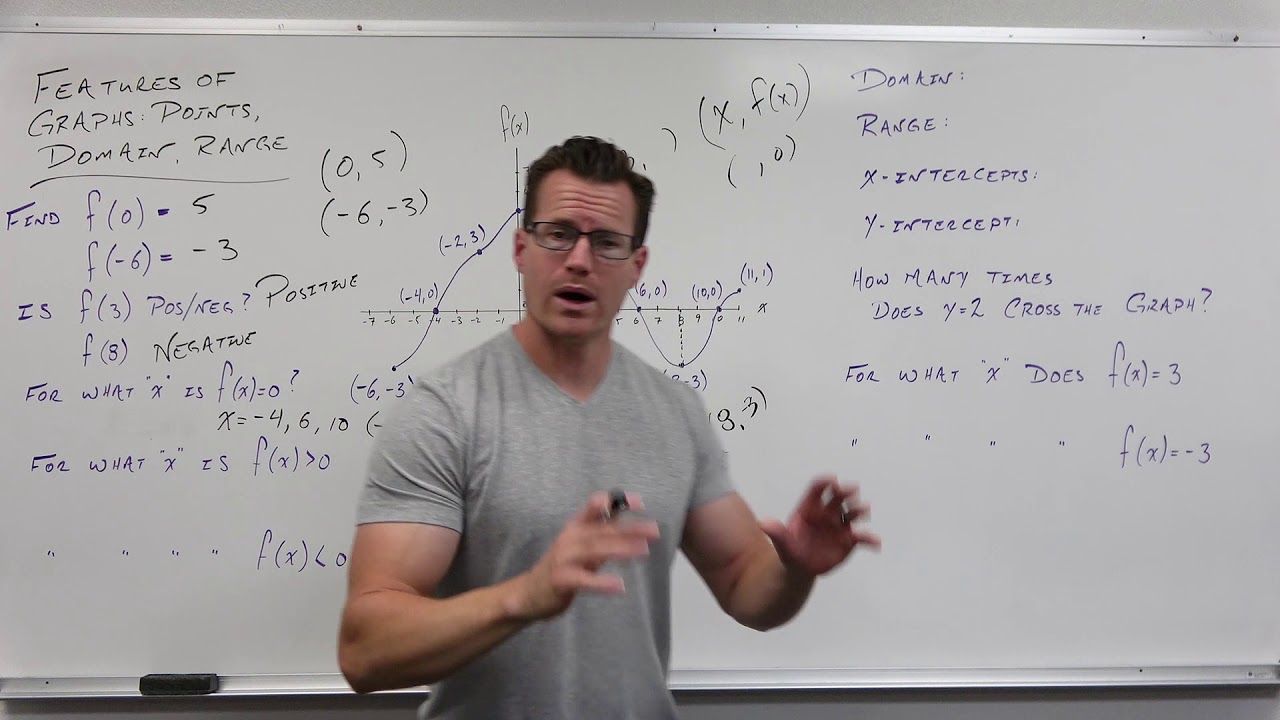
This paragraph introduces the concepts of domain and range in the context of functions, explaining how to determine them using interval notation based on the graph of a function. The domain represents the set of all possible x-values, while the range corresponds to the set of all possible y-values. The explanation begins with a specific function, detailing how to find the lowest and highest x-values to define the domain and similarly, how to find the lowest and highest y-values to define the range. The use of brackets and parentheses in interval notation is clarified, indicating whether the endpoints are included or excluded.
📈 Determining Domain and Range with Graph Examples
This paragraph delves into the practical application of determining the domain and range of functions by analyzing different graphs. It provides a series of examples, each with unique graph characteristics, such as open and closed circles, arrows indicating infinity, and discontinuities in the graph. The explanation includes how to interpret these graphical elements and translate them into interval notation for both domain and range. It emphasizes the importance of understanding whether values are included or excluded, as indicated by the use of brackets and parentheses. The paragraph aims to solidify the viewer's comprehension of the concepts through practical application.
🔍 Advanced Examples and Interval Notation
The final paragraph presents more complex examples to challenge the viewer's understanding of domain and range using interval notation. It introduces the concept of using the union symbol to combine separate parts of a function's graph that are disconnected. The explanation covers scenarios where the graph has multiple distinct sections, each with its own domain and range, and demonstrates how to find the overall domain and range by combining these sections. The paragraph reinforces the concept of interval notation and its utility in accurately representing the domain and range of functions, even in more intricate cases. It encourages viewers to practice and solidify their grasp of the material through these advanced examples.
Mindmap
Keywords
💡domain
💡range
💡interval notation
💡x values
💡y values
💡open circle
💡closed circle
💡arrow
💡union
💡parabola
💡piecewise function
Highlights
Introduction to domain and range in the context of functions.
Domain represents the x-values of a function, while range represents the y-values.
Interval notation is used to express the domain and range of functions graphically.
The lowest and highest x-values define the domain of a function.
The lowest and highest y-values define the range of a function.
Closed circles on the graph indicate inclusion of the point in the domain or range.
Open circles signify that the point is not included in the domain or range.
Arrows on the graph indicate that the function extends to infinity in that direction.
Domain and range can be determined by analyzing the continuity and breaks in a graph.
Use of brackets and parentheses in interval notation corresponds to whether values are included or excluded.
The union symbol in interval notation connects separate ranges of a function that have gaps.
Complex functions with jumps or breaks can be expressed by separating the domain and range into distinct intervals.
The video provides a methodical approach to understanding and applying interval notation to various function graphs.
Practical examples are used to illustrate how to determine domain and range for different types of functions.
The video emphasizes the importance of recognizing and correctly interpreting graphical elements such as circles and arrows.
The process of determining domain and range involves identifying key x and y values and their corresponding inclusion or exclusion.
The video serves as an educational resource for learning how to interpret and work with domain and range in function graphs.
Transcripts
Browse More Related Video


5.0 / 5 (0 votes)
Thanks for rating: