AP Physics Workbook 2.A Relationship Between Force and Acceleration
TLDRThis video script from the AP Physics workbook delves into the dynamics of force and acceleration, illustrating their inverse relationship through a graphical representation. By plotting mass against acceleration, the video demonstrates how acceleration decreases with an increase in mass, conforming to an inverse proportionality. It further explains the process of linearization, showing how graphing '1/mass' against acceleration results in a linear relationship. The slope of this line, defined by the change in acceleration over the change in '1/mass', is identified as the force, aligning with the fundamental physics principle that force equals mass times acceleration. The video also distinguishes between contact and non-contact forces, offering a comprehensive understanding of the concept of force in physics.
Takeaways
- 📈 The relationship between force and acceleration is central to understanding dynamics in physics.
- 🔍 In the given scenario, a chart is used to represent the relationship between mass (X-axis) and acceleration (Y-axis).
- 📌 Points on the chart represent the mass and acceleration of different objects, such as (2 kg, 1.5 m/s²) and (4 kg, 0.75 m/s²).
- ➖ The graph illustrates an inverse relationship: as mass increases, acceleration decreases, indicating a negative correlation.
- 🤔 To linearize the relationship, one variable must be inverted, such as plotting acceleration versus 1/mass or mass versus 1/acceleration.
- 🆒 The linearization results in a linear line, which can be achieved by drawing a line of best fit through the plotted points.
- 📐 The slope of the linearized graph is of particular interest; it represents the product of mass and acceleration.
- 💡 In physics, the slope (mass × acceleration) corresponds to the force acting on the object, as per the definition of force (F = ma).
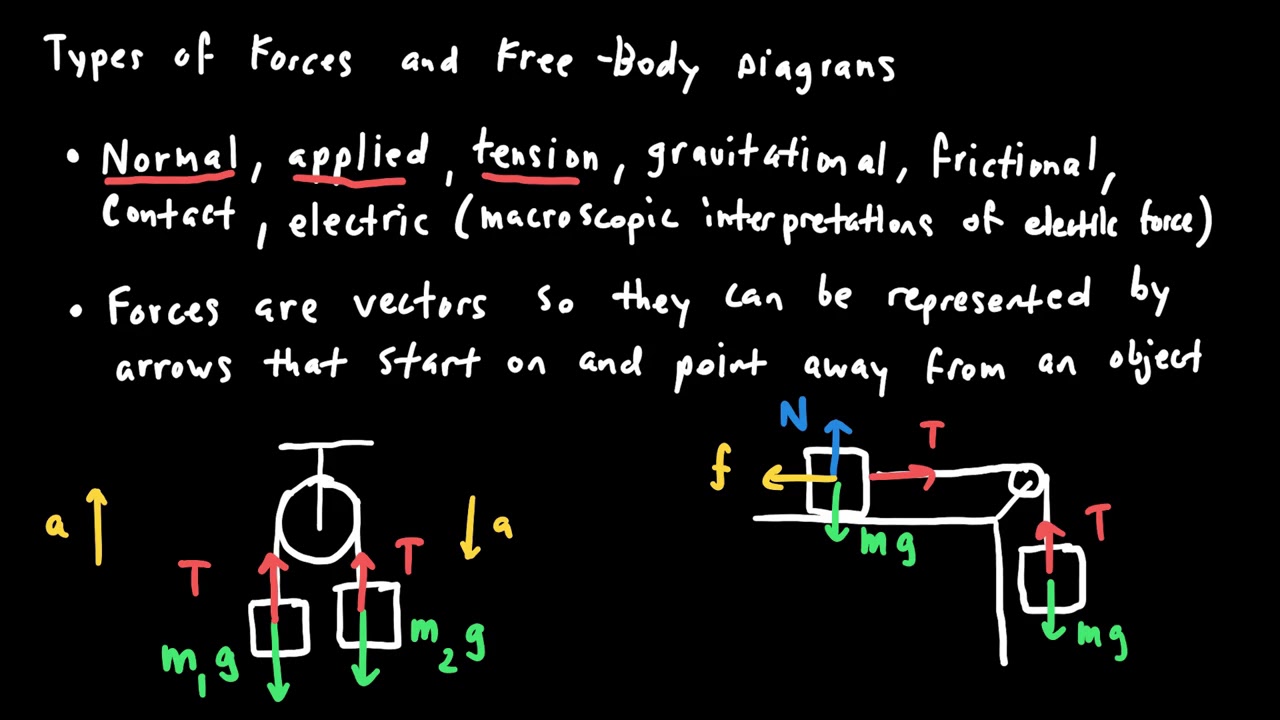
- 🛠️ Understanding force is crucial as it is a push or pull on an object, which can be contact force (like hitting a nail with a hammer) or non-contact force (like gravity).
- 📚 The concept is fundamental for AP Physics, where force is defined as the result of the summation of all forces acting on an object.
- 🎓 This analysis helps students grasp the basic principles of dynamics, emphasizing the importance of visual representation and mathematical interpretation.
Q & A
What is the main topic of Unit 2 in the AP Physics workbook?
-The main topic of Unit 2 is Dynamics, specifically focusing on the relationship between force and acceleration.
How is the data represented in the chart mentioned in the transcript?
-The data is represented with mass on the x-axis and acceleration on the y-axis, showing the acceleration of each box versus its mass.
What does the first point on the chart represent?
-The first point represents an object with a mass of 2 kilograms and an acceleration of 1.5, denoted as (2, 1.5).
Based on the chart, what is the correct relationship between the acceleration and the mass of the object?
-The correct relationship is that as mass (x-axis) increases, acceleration (y-axis) decreases, indicating an inverse proportionality between mass and acceleration.
How can the graph be transformed to create a linear relationship?
-The graph can be transformed by graphing acceleration versus the reciprocal of mass (1/mass), which results in a linear relationship.
What does the slope of the linearized graph represent in the context of physics?
-The slope of the linearized graph represents the force acting on the object, as force is equal to mass times acceleration according to the formula F = ma.
What is the physical meaning of the term 'force' in physics?
-In physics, force refers to any kind of push or pull on an object. It can be a contact force, like hitting a nail with a hammer, or a non-contact force, such as gravity.
How is the best-fit line determined when linearizing data?
-The best-fit line is determined by ensuring that there are an equal number of points above the line and below the line, capturing the overall trend of the data.
What is the significance of the inverse relationship between mass and acceleration in the context of the given scenario?
-The inverse relationship indicates that for a constant force, as the mass of an object increases, its acceleration decreases, which is a fundamental concept in understanding Newton's second law of motion.
How does the concept of linearization help in understanding physical laws?
-Linearization helps in understanding physical laws by simplifying complex relationships into linear equations, making it easier to analyze and predict behaviors in physical systems.
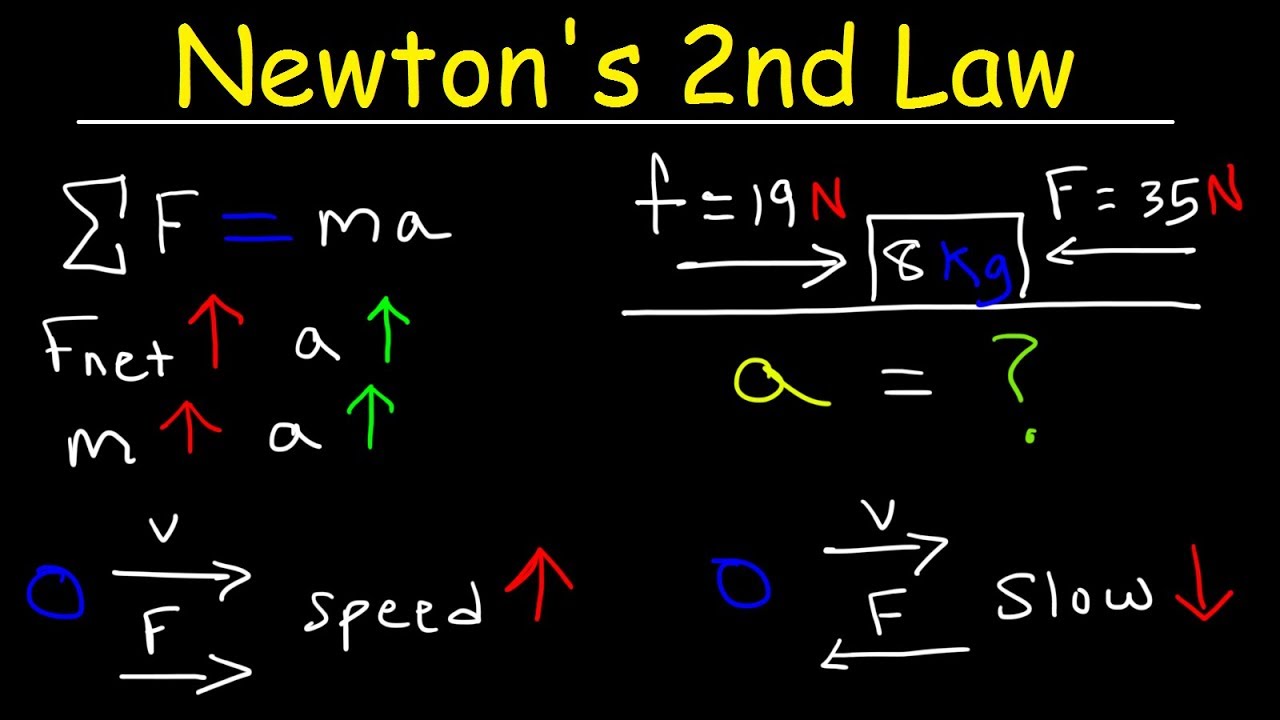
What is the summation of forces defined as in the context of the AP Physics formula sheet?
-The summation of forces is defined as the total force acting on an object, which is equal to the mass of the object multiplied by its acceleration (F = ma).
Outlines
📚 Introduction to Dynamics and Force-Acceleration Relationship
This paragraph introduces the topic of Dynamics from the AP Physics workbook, focusing on the relationship between force and acceleration. It presents a scenario with a chart that plots mass on the x-axis and acceleration on the y-axis. The key points discussed include the inverse relationship between mass and acceleration, where an increase in mass results in a decrease in acceleration. The paragraph emphasizes understanding this relationship through the graph provided and identifying the correct mathematical representation, which is acceleration being inversely proportional to mass. The task for the audience is to fill in the blank with the correct relationship based on the graph, which should indicate a negative correlation between mass (X) and acceleration (Y).
📈 Graphing Techniques and Linearization
The second paragraph delves into the process of graphing and linearization to better understand the relationship between mass and acceleration. It explains how to transform the graph by inverting the mass (flipping it from the numerator to the denominator) to create a linear relationship. The paragraph provides a step-by-step guide on graphing acceleration versus one over mass, which results in a linear line. The best-fit line is discussed, emphasizing the importance of evenly distributing points above and below this line. The physical meaning of the slope in this linearized graph is explored, revealing that the slope represents the force, as per Newton's second law of motion (F = ma). The paragraph also includes a brief explanation of the concept of force, distinguishing between contact and non-contact forces, and reiterating the fundamental definition of force as a push or pull on an object.
Mindmap
Keywords
💡Physics
💡Force
💡Acceleration
💡Mass
💡Dynamics
💡Graph
💡Inverse Proportion
💡Linearization
💡Slope
💡Best Fit Line
💡AP Physics
Highlights
The transcript discusses the relationship between force and acceleration in dynamics.
The representation of the relationship is through a chart with mass on the x-axis and acceleration on the y-axis.
The scenario involves plotting the force and acceleration of objects with different masses.
The first point on the chart represents an object with a mass of 2 kg and an acceleration of 1.5.
The second point is for an object with a mass of 4 kg and an acceleration of 0.75.
The graph shows that as mass increases, acceleration decreases, indicating an inverse proportionality.
Part A of the exercise asks to identify the correct relationship between acceleration and mass based on the graph.
Part B instructs to graph the relationship by flipping the axes, resulting in a linear graph.
The physical meaning of the slope in the linearized graph is discussed in Part C.
The slope of the linearized graph represents the force, as force is mass times acceleration.
Force is defined as any kind of push or pull on an object.
There are two types of forces: contact force, like hitting a nail with a hammer, and non-contact force, like gravity.
The summation of forces is equal to mass times acceleration, which is the fundamental equation of motion in physics.
The exercise aims to provide a better understanding of the concept of force and its applications in physics.
The process of graphing and linearizing helps to visualize and understand the relationship between physical quantities.
The transcript provides a comprehensive walkthrough of the physics problem, enhancing the learning experience.
The use of a chart and linearization techniques in the transcript demonstrates practical approaches to solving physics problems.
The transcript emphasizes the importance of accurately plotting and interpreting data in physics.
The explanation of inverse proportionality in the context of force and mass is a key concept in understanding dynamics.
Transcripts
Browse More Related Video

AP Physics Workbook 2.E Newton's Second and Third Laws

2ND LAW OF MOTION: LAW OF ACCELERATION (TAGALOG)

Newton's Second Law of Motion | #aumsum #kids #science #education #children
AP Physics 1 Dynamics Review
Newton's Second Law of Motion - Force, Mass, & Acceleration

2021 Live Review 3 | AP Physics 1 | Understanding Circular Motion and Gravitation
5.0 / 5 (0 votes)
Thanks for rating: